
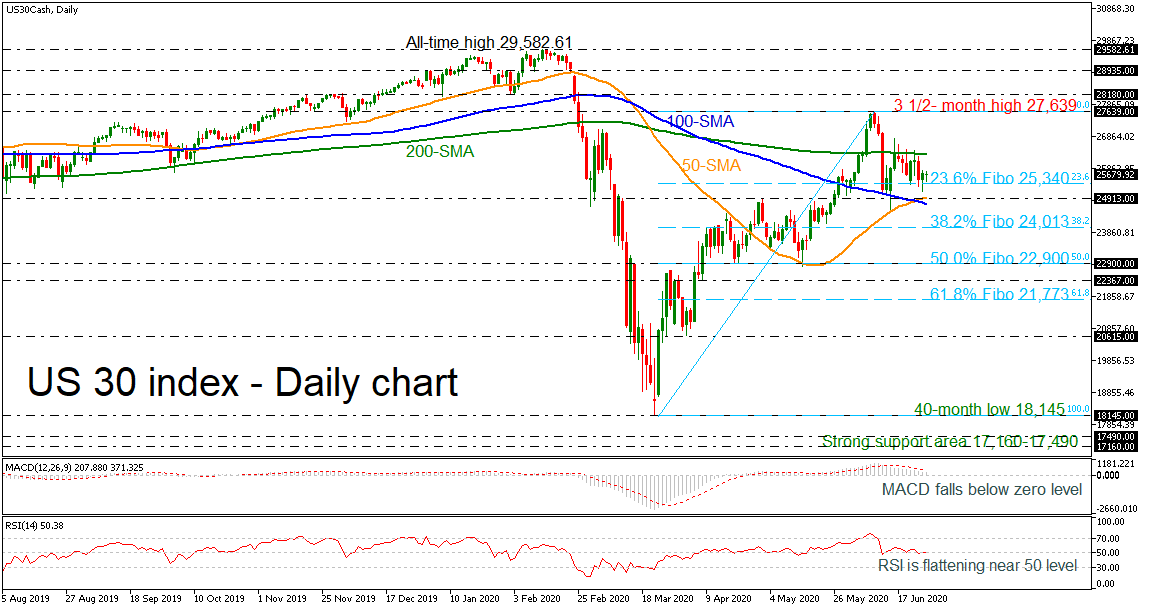
The US 30 cash index has lost its strong positive momentum after the pullback from the three-and-half month high of 27,369 on June 9. The price found strong resistance at the 200-period simple moving average (SMA) over the last few days and is still consolidating above the 23.6% Fibonacci retracement level of the up leg from 18,145 to 27,639 at 25,340.
According to the technical indicators, the MACD is losing ground below the trigger line, while the RSI is moving sideways in line with the 50 neutral mark.
A move to the downside would find strong support at the 23.6% Fibo of 25,340 before hitting the 50-day SMA, which coincides with the 24,913 barrier. Below that, the 38.2% Fibonacci of 24,013 could come in focus ahead of the 22,900 support, being the 50.0% Fibonacci.
Alternatively, a strong push above the 200-day SMA could send the index until the 27,639 hurdle and the 28,180 resistance. Further upside movement could open the way for 28,935 and the all-time high of 29,582.61.
Concluding, the index has been in a bullish mode since the rebound on the 40-month trough of 18,145 despite the latest negative movement.


