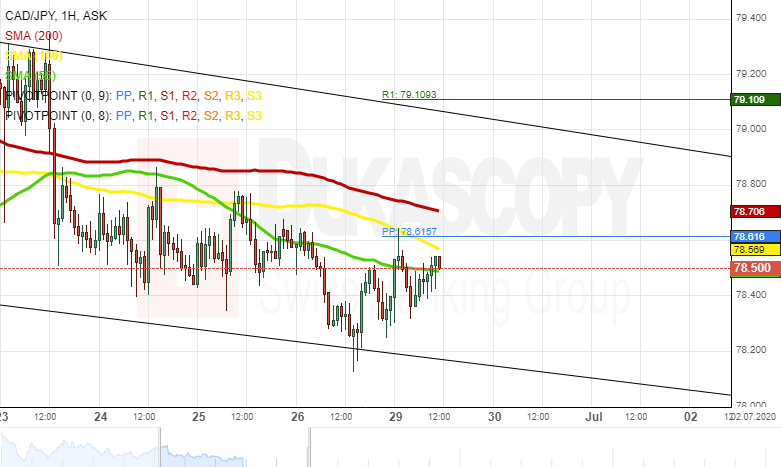
The CAD/JPY exchange rate has been declining within a falling wedge pattern since the middle of June.
From a theoretical point of view, it is likely that a breakout north could occur within the following trading sessions. In this case the currency pair could re-test the psychological level at 82.00.
Meanwhile, note that the exchange rate is pressured by the 55-, 100– and 200-hour moving averages. Thus, a breakout south could occur in the nearest future, and the rate could re-test the 75.00 level.