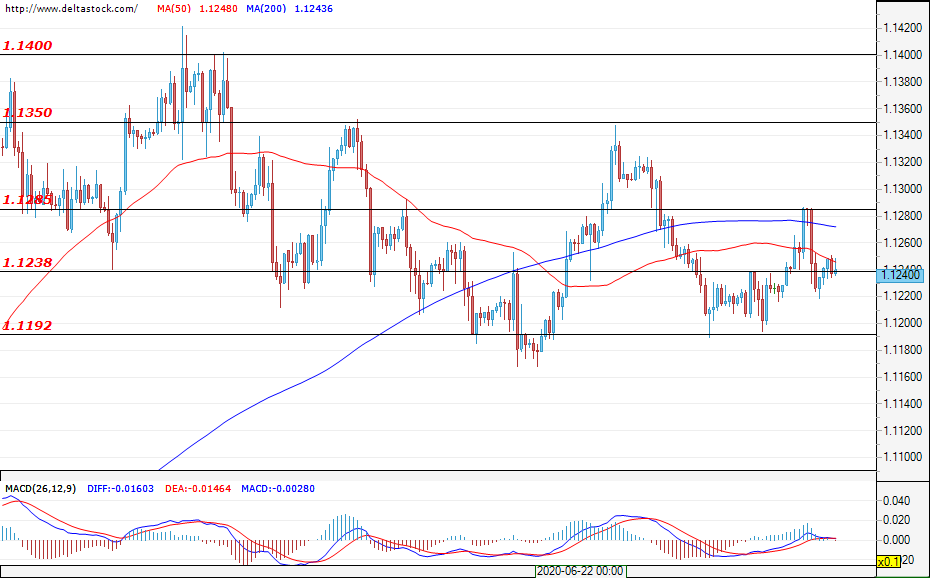
EUR/USD
Current level – 1.1240
The pair couldn’t hold on to its gains and prices bounced from the resistance at 1.1285. At the time of writing, trading is gravitating around the resistance 1.1240. If that level is violated, we can expect a new move towards the newly formed support around 1.1190. Throughout almost the entire month of June, trading remained stuck between 1.1180 and 1.1400 with a slight advantage to the bear side, due to the new lower highs of the market. If sellers overcome the zone around 1.1190, they should probably be able to push prices lower to the next support zone at 1.0980. For the bulls’ side, first resistance zones can be found at 1.1285 and the major one at 1.1350. However, if bulls get a boost and manage to hold the price above 1.1180 and overcome 1.1350-1.1400, a new rally towards 1.1800 can be expected. Today, a series of consumer price index data is expected for the Eurozone (09:00 GMT) that can prop market activity.
| Resistance | Support | ||
| intraday | intraweek | intraday | intraweek |
| 1.1285 | 1.1400 | 1.1240 | 1.1100 |
| 1.1350 | 1.1500 | 1.1190 | 1.0980 |
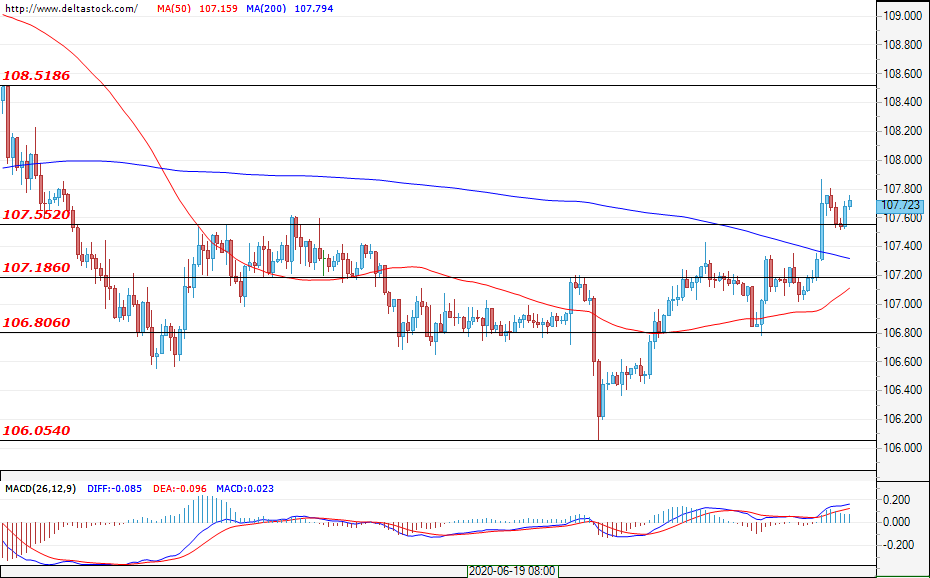
USD/JPY
Current level – 107.72
After yesterday’s rally, the pair managed to breach both resistance zones at 107.20 and 107.55. Sentiment seems positive and the move can continue towards the next resistance zones 108.50 and even 109.25. Currently, bulls can find support around 107.00-106.80.
| Resistance | Support | ||
| intraday | intraweek | intraday | intraweek |
| 108.00 | 108.50 | 107.55 | 106.00 |
| 108.50 | 109.25 | 106.80 | 105.00 |
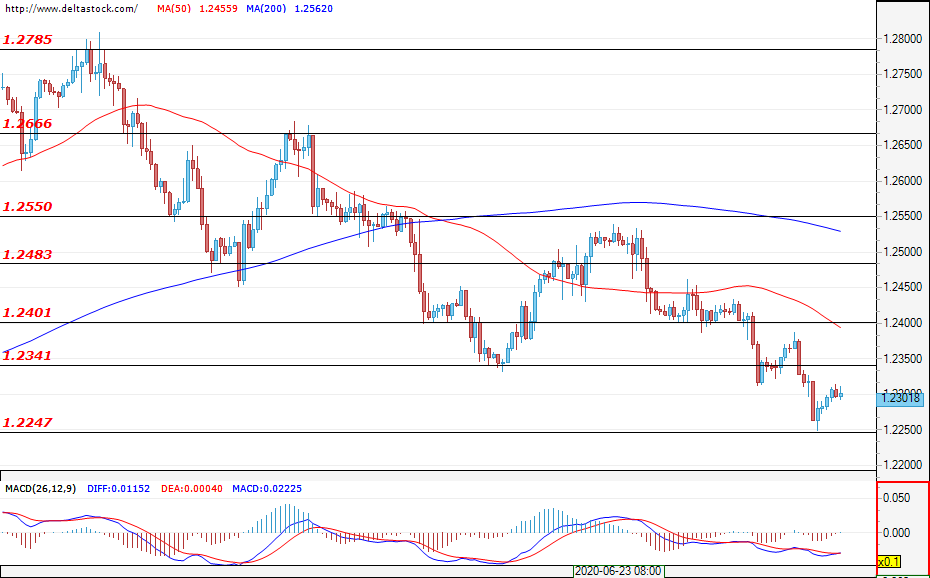
GBP/USD
Current level – 1.2301
The British pound locked in another day in the red after fears of an increase in government spending and dead-end talks with the EU on the trade agreement. Bears managed to breach the support at 1.2340 and the sell-off stopped at the next support 1.2250. Currently the market is in a pullback phase and it should remain limited below 1.2400. If bears continue their pressure, they might try to take on 1.2160 and if it’s violated, the next stop could be the March lows around 1.15.
| Resistance | Support | ||
| intraday | intraweek | intraday | intraweek |
| 1.2340 | 1.2480 | 1.2250 | 1.2160 |
| 1.2400 | 1.2550 | 1.2250 | 1.1800 |