
The EUR/USD currency pair
Technical indicators of the currency pair:
Prev Open: 1.12166
Open: 1.12361
% chg. over the last day: +0.17
Day’s range: 1.12041 – 1.12518
52 wk range: 1.0777 – 1.1494
There is an ambiguous technical pattern on the EUR/USD currency pair. The trading instrument is in a sideways trend. At the moment, the local support and resistance levels are 1.1210 and 1.1250, respectively. The demand for risky assets has been resumed amid signs of global economic recovery. Financial market participants expect a speech by the Fed Chairman. Positions should be opened from key levels.
The Economic News Feed for 2020.06.30:
Consumer price index in the Eurozone at 12:00 (GMT+3:00);
CB consumer confidence index in the US at 17:00 (GMT+3:00).
At 19:30 (GMT+3:00), the Fed Chairman will give a speech.
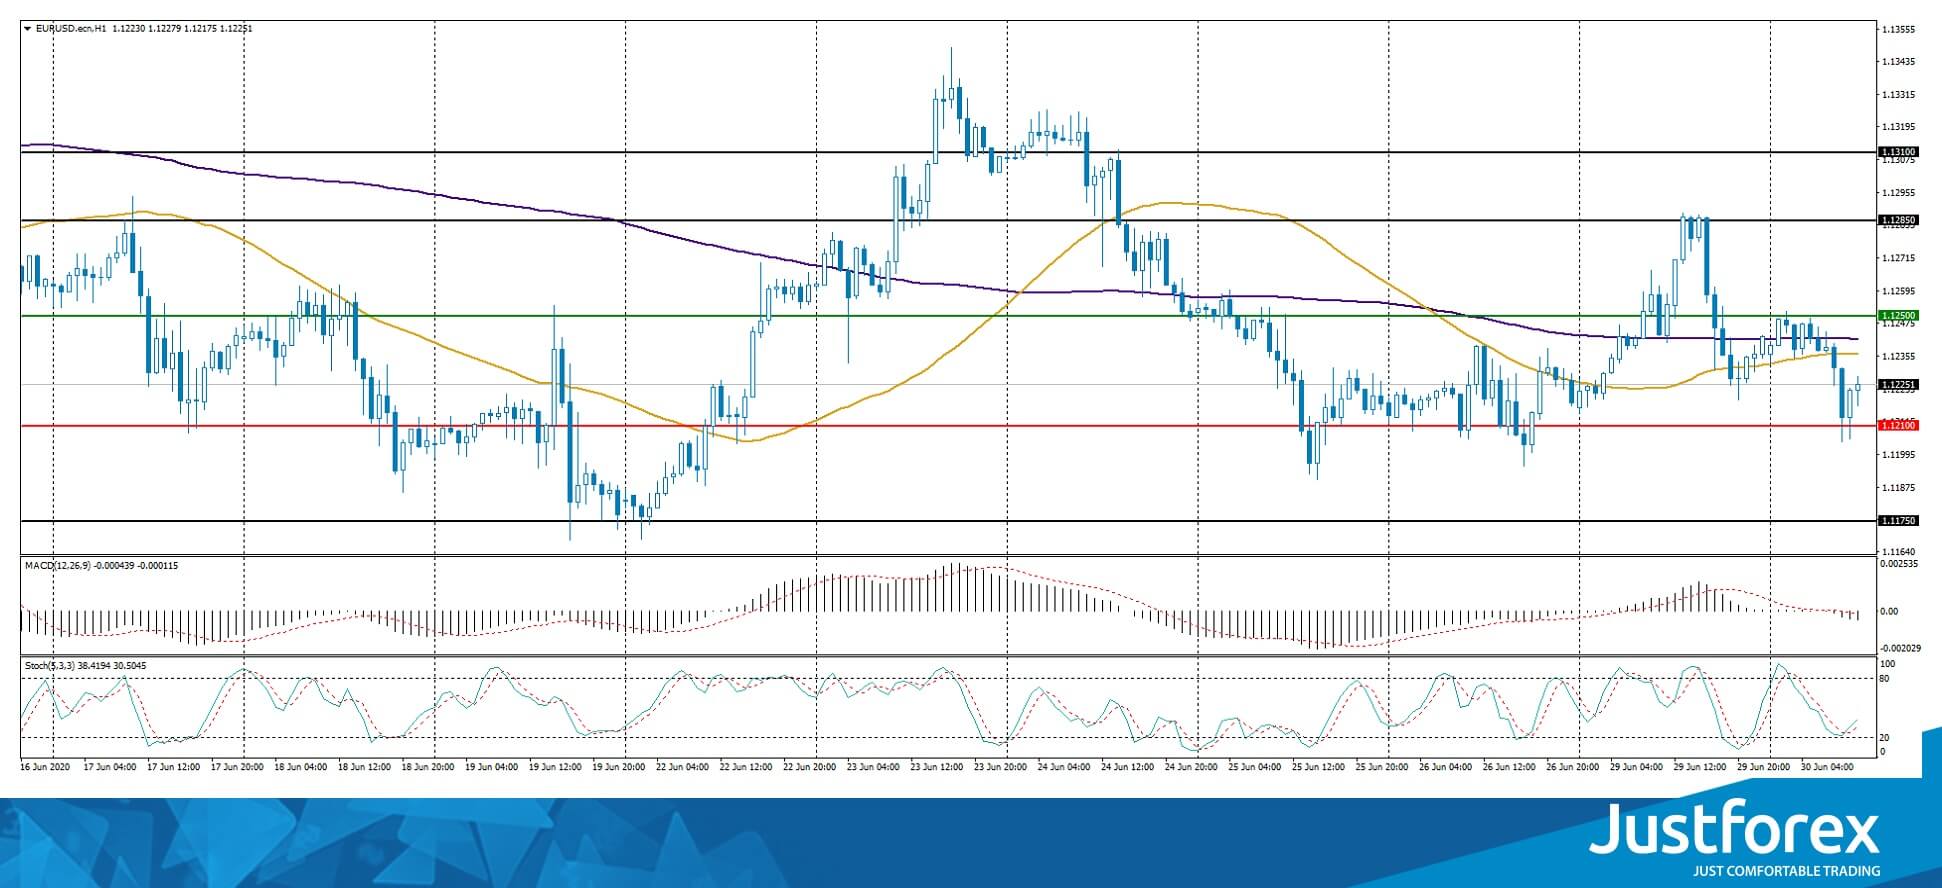
Indicators do not give accurate signals: 50 MA has crossed 100 MA.
The MACD histogram has started declining, which indicates the development of bearish sentiment.
Stochastic Oscillator is in the neutral zone, the %K line is above the %D line, which gives a signal to buy EUR/USD.
Trading recommendations
Support levels: 1.1210, 1.1175, 1.1140
Resistance levels: 1.1250, 1.1285, 1.1310
If the price fixes below the level of 1.1210, EUR/USD quotes are expected to fall. The movement is tending to 1.1175-1.1140.
An alternative could be the growth of the EUR/USD currency pair to 1.1280-1.1300.
The GBP/USD currency pair
Technical indicators of the currency pair:
Prev Open: 1.23313
Open: 1.22995
% chg. over the last day: -0.34
Day’s range: 1.22595 – 1.23170
52 wk range: 1.1466 – 1.3516
The GBP/USD currency pair shows a negative trend. The British pound has set new local lows. Currently, GBP/USD quotes are consolidating in the range of 1.2260-1.2315. The British pound is still under pressure amid weak UK GDP report. A trading instrument has the potential for further decline. Today we recommend paying attention to the news feed on the US economy. Positions should be opened from key levels.
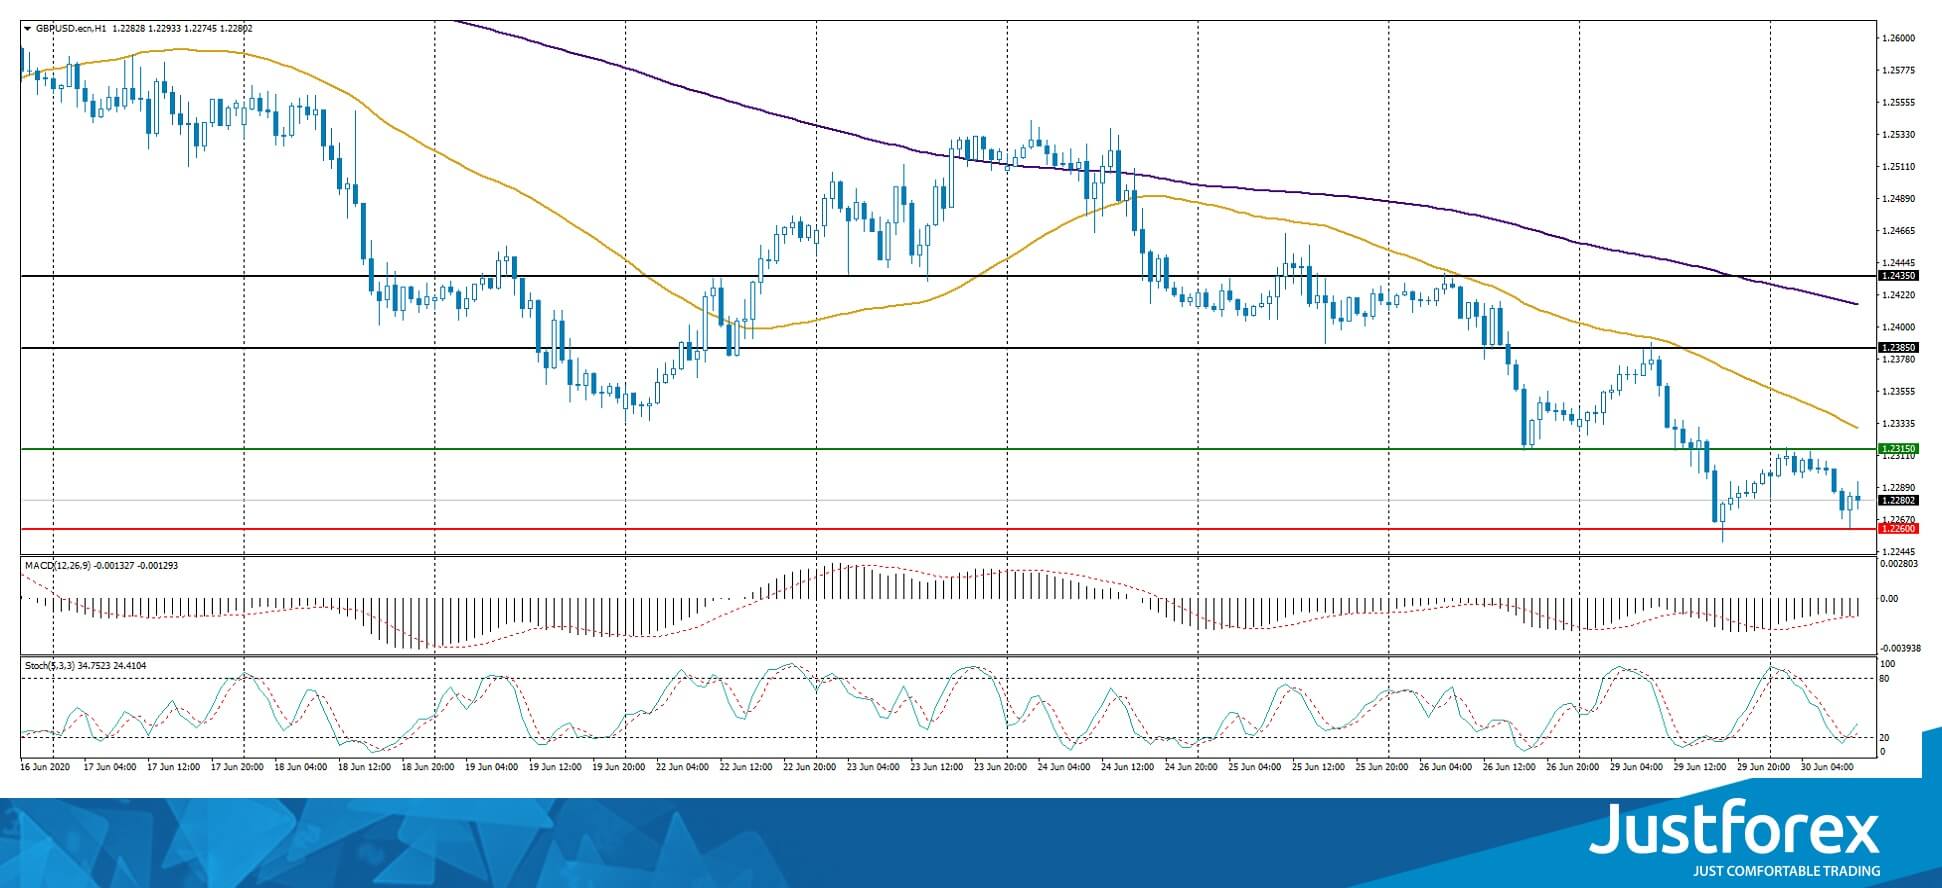
Indicators signal the power of sellers: the price has fixed below 50 MA and 100 MA.
The MACD histogram is in the negative zone, which gives a signal to sell GBP/USD.
Stochastic Oscillator is in the neutral zone, the %K line is above the %D line, which indicates the development of bullish sentiment.
Trading recommendations
Support levels: 1.2260, 1.2200
Resistance levels: 1.2315, 1.2385, 1.2435
If the price fixes below 1.2260, a further fall in GBP/USD quotes is expected. The movement is tending to the round level of 1.2200.
An alternative could be the growth of the GBP/USD currency pair to 1.2360-1.2400.
The USD/CAD currency pair
Technical indicators of the currency pair:
Prev Open: 1.36766
Open: 1.36588
% chg. over the last day: -0.16
Day’s range: 1.36528 – 1.36949
52 wk range: 1.2949 – 1.4668
The loonie has become stable. USD/CAD quotes are in a sideways trend. There is no defined trend. The key support and resistance levels are 1.3650 and 1.3715, respectively. Financial market participants expect additional drivers. We recommend paying attention to the dynamics of “black gold” prices. Positions should be opened from key levels.
At 15:30 (GMT+3:00), Canada’s GDP data will be published.
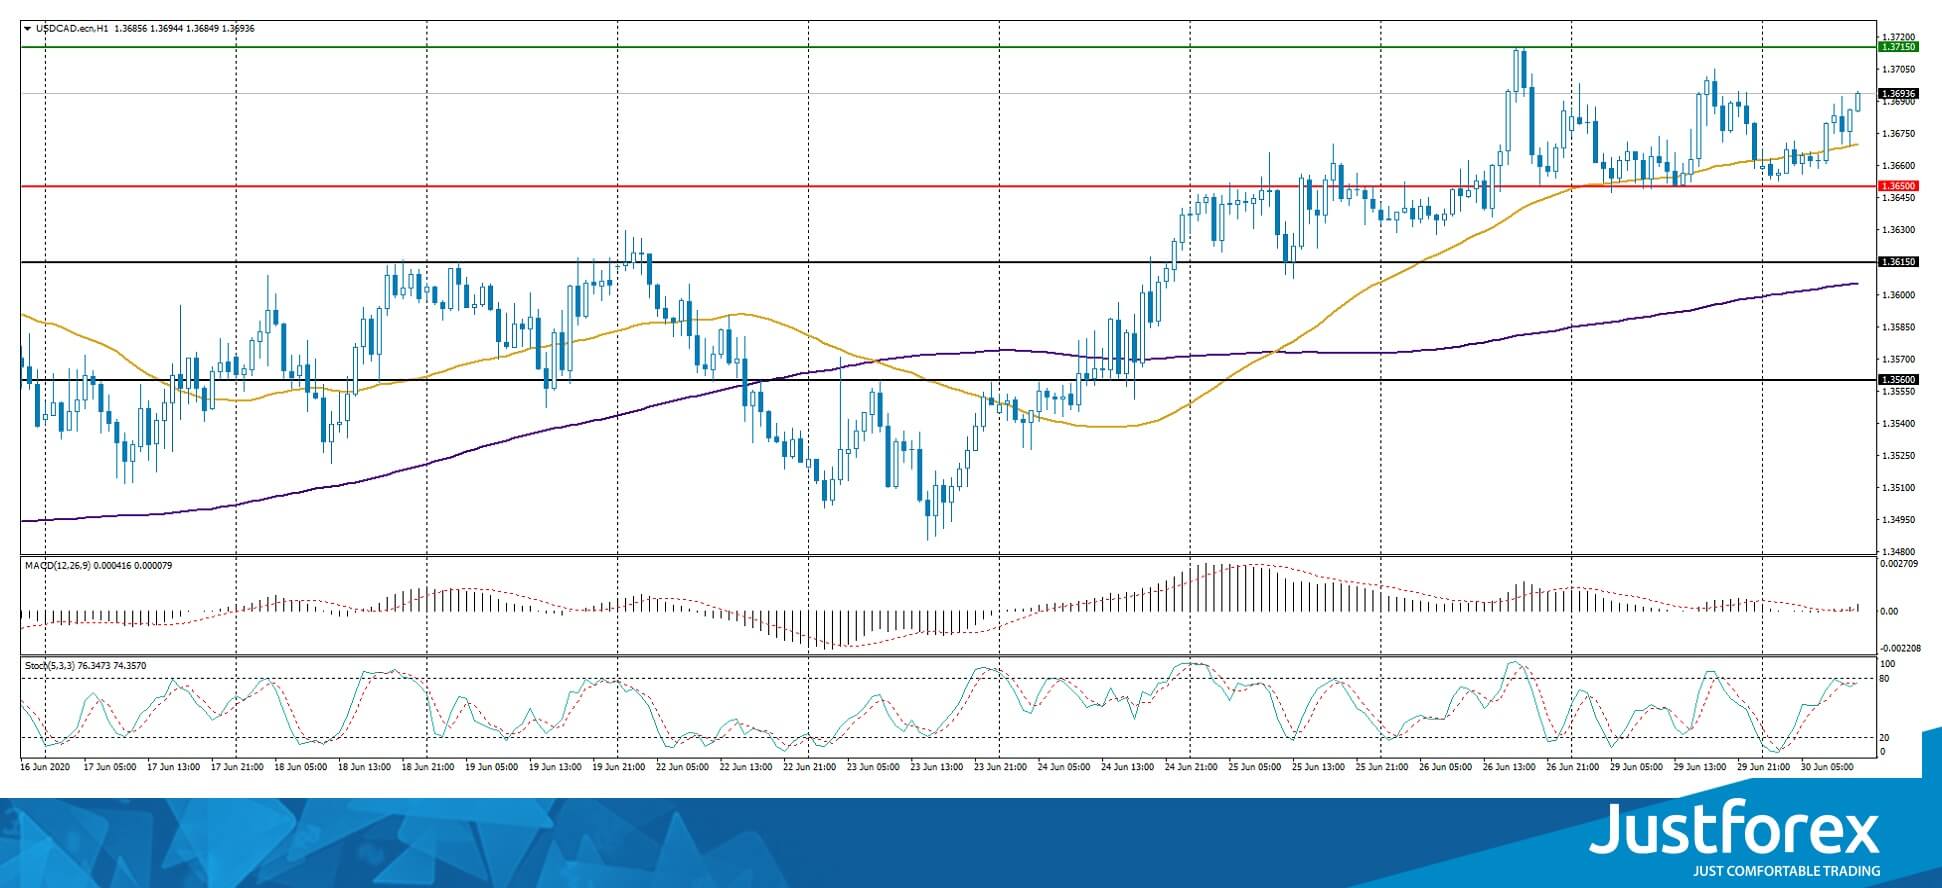
Indicators indicate the power of buyers: the price has fixed above 50 MA and 100 MA.
The MACD histogram has started rising, which indicates the development of bullish sentiment.
Stochastic Oscillator is in the neutral zone, the %K line has crossed the %D line. There are no signals at the moment.
Trading recommendations
Support levels: 1.3650, 1.3615, 1.3560
Resistance levels: 1.3715, 1.3750
If the price fixes above 1.3715, further growth of USD/CAD quotes is expected. The movement is tending to 1.3750-1.3770.
An alternative could be a decrease in the USD/CAD currency pair to 1.3620-1.3580.
The USD/JPY currency pair
Technical indicators of the currency pair:
Prev Open: 107.072
Open: 107.563
% chg. over the last day: +0.17
Day’s range: 107.527 – 107.787
52 wk range: 101.19 – 112.41
Purchases prevail on the USD/JPY currency pair. The trading instrument has overcome and fixed above the key extremes. At the moment, the “safe haven” currency is consolidating. The local support and resistance levels are 107.55 and 107.85, respectively. USD/JPY quotes have the potential for further growth. We recommend paying attention to the dynamics of US government bonds yield. Positions should be opened from key levels.
The news feed on Japan’s economy is quite calm.
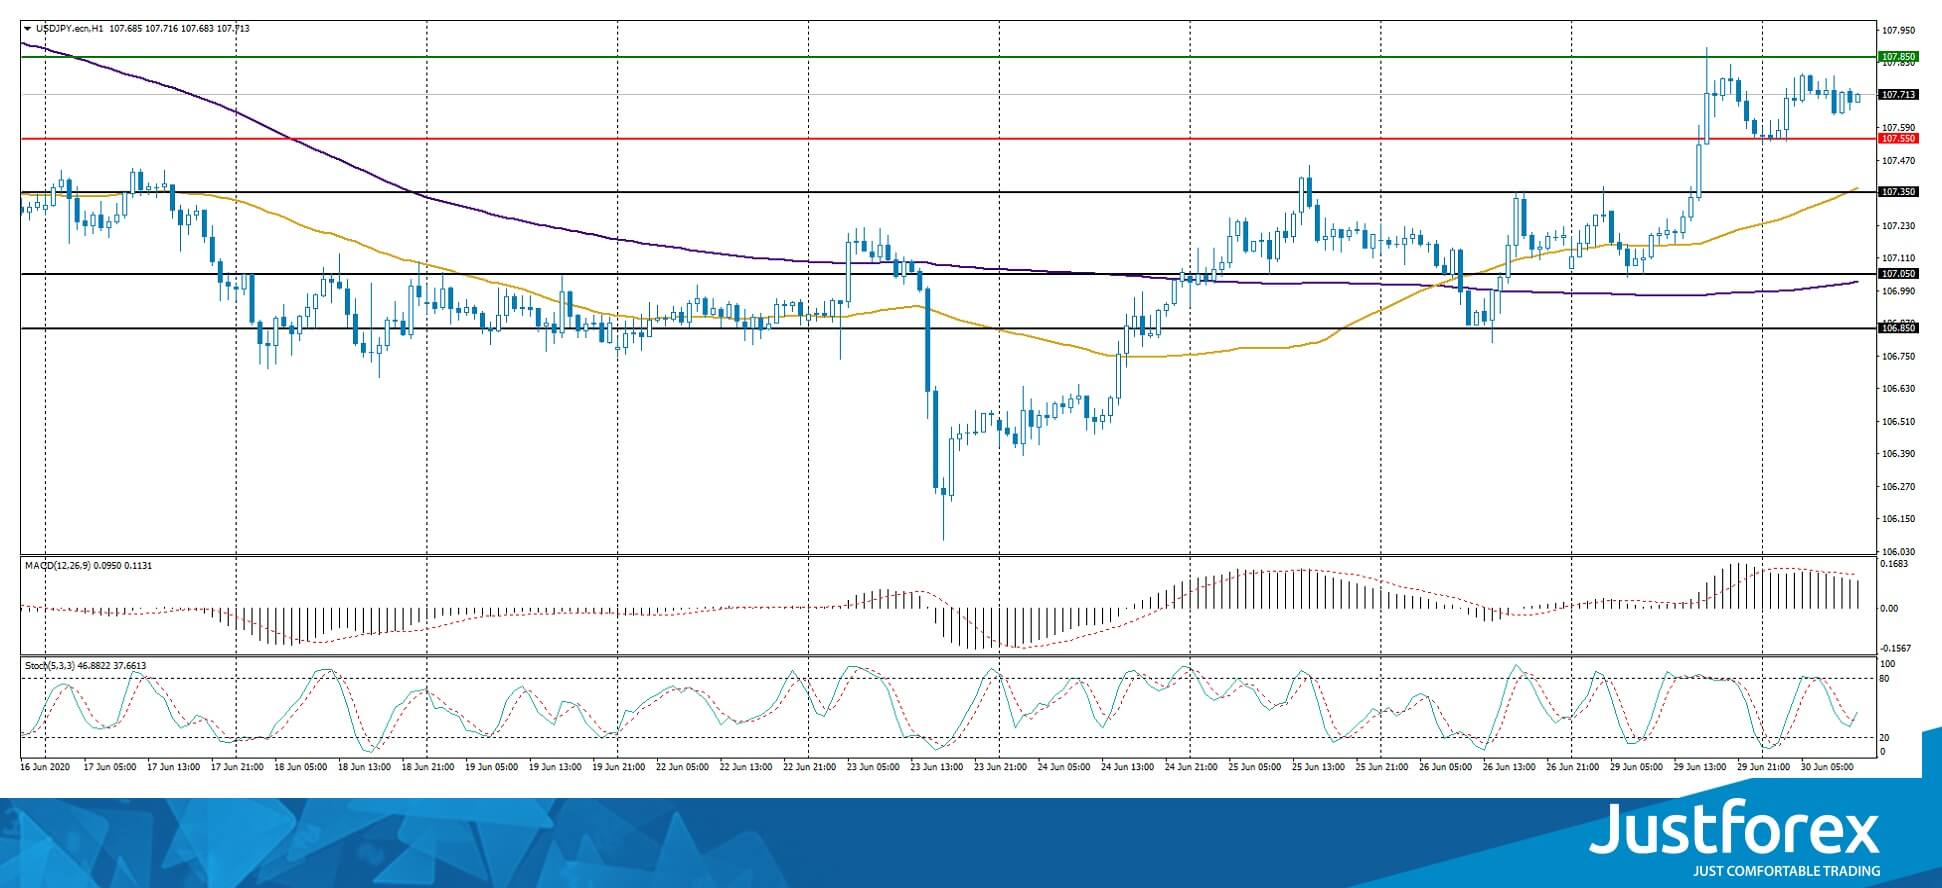
Indicators signal the power of buyers: the price has fixed above 50 MA and 100 MA.
The MACD histogram is in the positive zone, indicating the bullish sentiment.
Stochastic Oscillator is in the neutral zone, the %K line has crossed the %D line. There are no signals at the moment.
Trading recommendations
Support levels: 107.55, 107.35, 107.05
Resistance levels: 107.85, 108.20
If the price fixes above 107.85, further growth of USD/JPY quotes is expected. The movement is tending to 108.20-108.40.
An alternative could be a decrease in the USD/JPY currency pair to 107.35-107.10.


