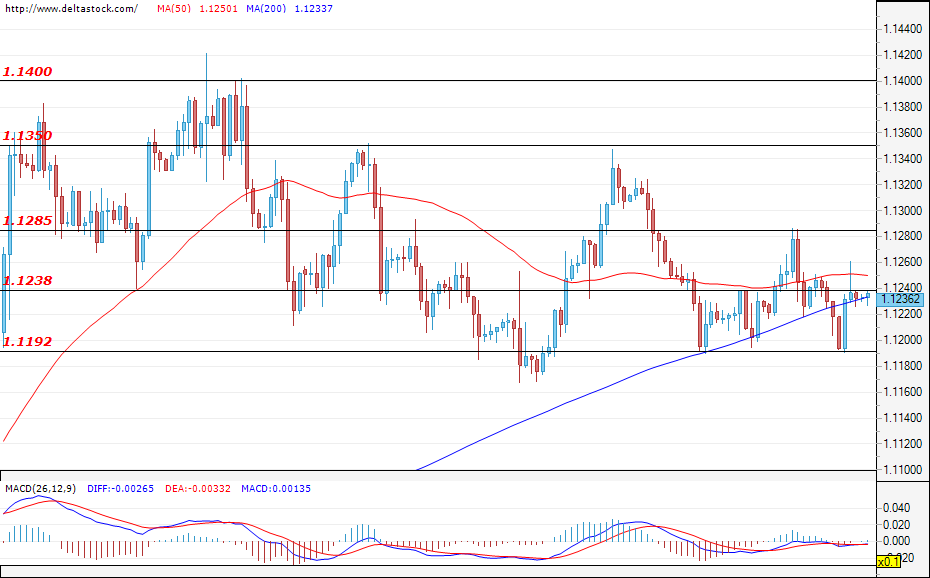
EUR/USD
Current level – 1.1236
The negative move from yesterday was limited to the support zone at 1.1192 as the EUR/USD bounced back to the resistance at 1.1240. At the time of writing, the price is consolidating just under the aforementioned resistance and it’s rather probable to see the bears re-enter the market and go for another test of 1.1192. If they manage to violate the mentioned support, further depreciation of the EUR against the USD will be in order and we might see bearish sentiment deepen, resulting in a move towards the support zone at 1.0980. In the positive direction, only a breach of the resistance level at 1.1285 and the next one at 1.1350 would paint a more bullish picture. Volatility should pick up after the announcement of the ISM Manufacturing data (14:00 GMT) and during the FOMC minutes (18:00 GMT).
| Resistance | Support | ||
| intraday | intraweek | intraday | intraweek |
| 1.1235 | 1.1350 | 1.1190 | 1.1192 |
| 1.1285 | 1.1400 | 1.1140 | 1.0980 |
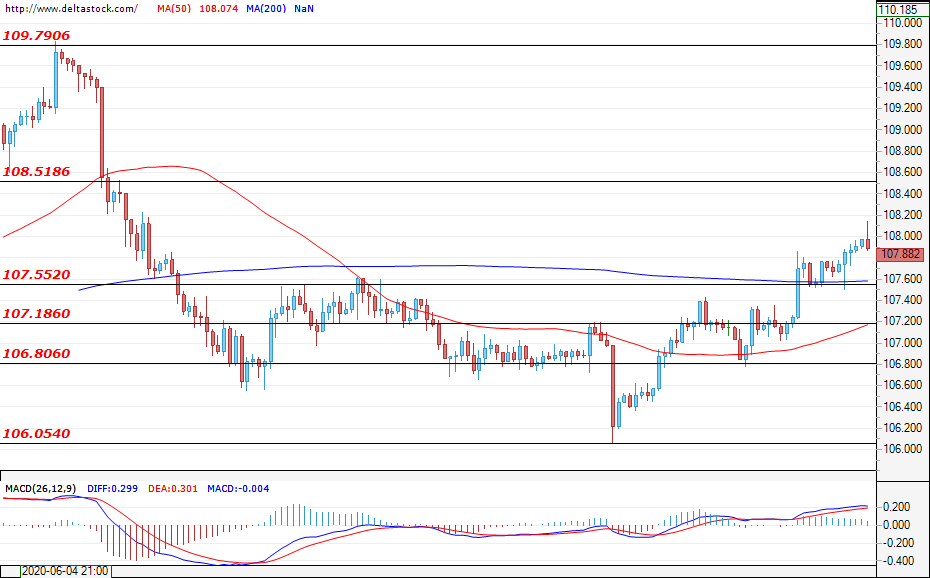
USD/JPY
Current level – 107.88
The bulls maintained control over the price and the currency pair successfully confirmed the violation of the resistance zone at 107.55, heading slowly to the next target laying at 108.51. A breach of this level would lead the price to the highs from the beginning of June, around 109.79, and will pave the way for further gains. If bears enter the market, their goal would be to bring the price back in the range from last month, targeting the support zones at 107.18 and 106.80.
| Resistance | Support | ||
| intraday | intraweek | intraday | intraweek |
| 108.00 | 108.50 | 107.55 | 106.00 |
| 108.50 | 109.25 | 106.80 | 105.00 |
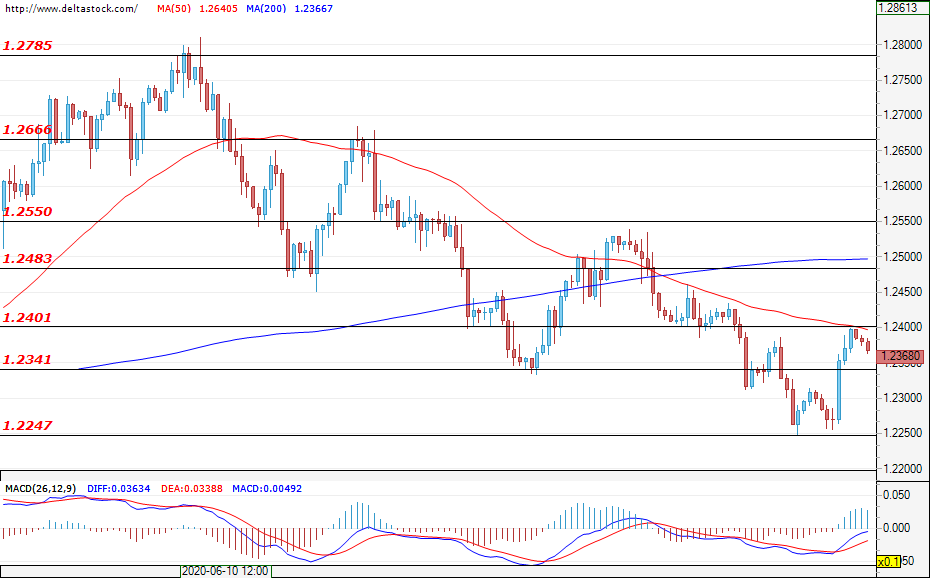
GBP/USD
Current level – 1.2368
The Cable showed a rise in GBP positivism and the pair manager to break through the resistance at 1.2341, but the move was limited to the next one at 1.2401. A successful violation of the aforementioned level will draw a more bullish picture and will lay the foundations for a move towards 1.2483. In the opposite scenario, the first support lies at the former resistance, now a support zone – 1.2341, followed by the lower one at 1.2247.
| Resistance | Support | ||
| intraday | intraweek | intraday | intraweek |
| 1.2400 | 1.2480 | 1.2341 | 1.2160 |
| 1.2483 | 1.2550 | 1.2250 | 1.1800 |