
The EUR/USD currency pair
Technical indicators of the currency pair:
Prev Open: 1.12347
Open: 1.12432
% chg. over the last day: +0.08
Day’s range: 1.12386 – 1.13027
52 wk range: 1.0777 – 1.1494
The EUR/USD quotes have been growing. The trading instrument has reached local highs. At the moment, the euro is testing the round level of 1.1300. The 1.1270 mark is immediate support. The technical pattern signals the further growth of the trading instrument. Investors are worried about new outbreaks of coronavirus in the United States. Today, the focus is on economic releases from the United States. We recommend opening positions from key support and resistance levels.
News feed for 2020.07.06:
At 17:00 (GMT+3:00), the ISM US Purchasing Managers Index will be published.
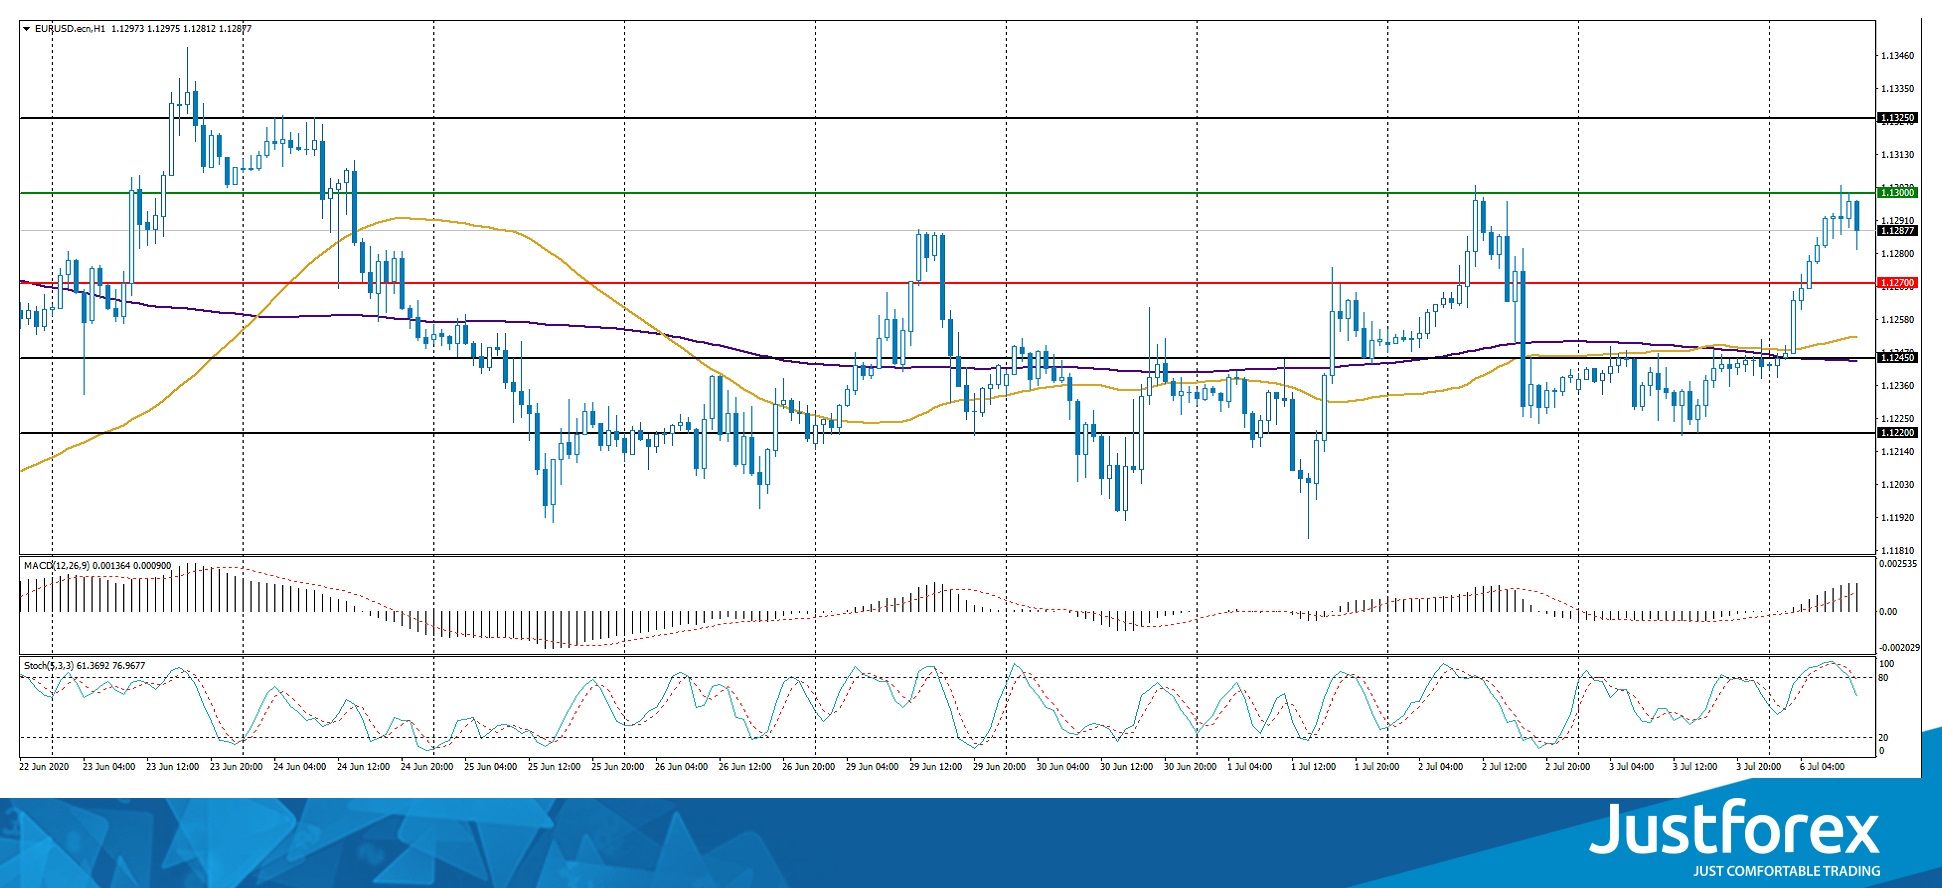
Indicators signal the power of buyers: the price has fixed above 50 MA and 100 MA.
The MACD histogram is in the positive zone, indicating bullish sentiment.
Stochastic Oscillator has started to go out of the overbought zone, the %K line is below the %D line, which gives a signal to sell EUR/USD.
Trading recommendations
Support levels: 1.1270, 1.1245, 1.1220
Resistance levels: 1.1300, 1.1325
If the price fixes above 1.1300, further growth of EUR/USD quotes is expected. The movement is tending to 1.1325-1.1350.
An alternative could be a decrease in the EUR/USD currency pair to 1.1245-1.1220.
The GBP/USD currency pair
Technical indicators of the currency pair:
Prev Open: 1.24640
Open: 1.24618
% chg. over the last day: -0.02
Day’s range: 1.24547 – 1.25097
52 wk range: 1.1466 – 1.3516
The GBP/USD currency pair is in a flat. Unidirectional trends are not observed. Participants in financial markets expect additional drivers. At the moment, the local support and resistance levels are 1.2460 and 1.2510, respectively. The pound sterling is tending to recover. We are expecting statistics from the USA. Positions must be opened from key levels.
In June, the index of business activity in the UK construction sector was 55.3, which is significantly higher than market expectations of 47.0.
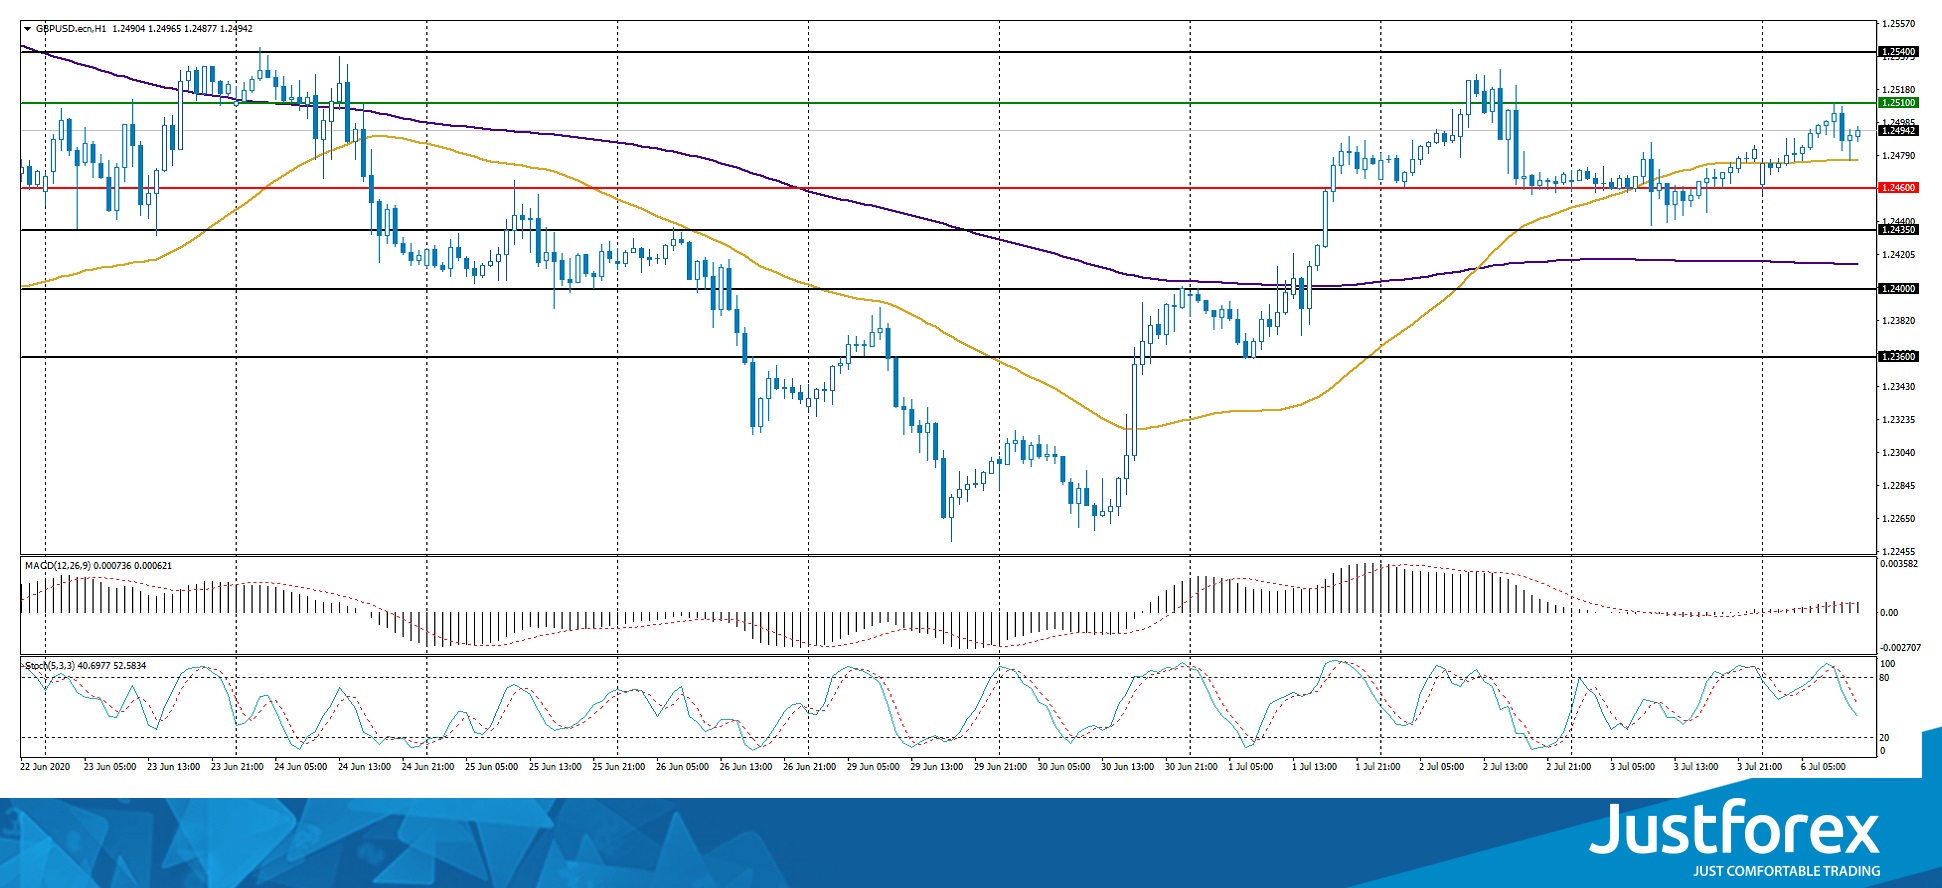
Indicators do not send accurate signals: the price is consolidating near 50 MA.
The MACD histogram is in the positive zone, indicating bullish sentiment.
Stochastic Oscillator is in the neutral zone, the %K line is below the %D line, which gives a signal to sell GBP/USD.
Trading recommendations
Support levels: 1.2460, 1.2435, 1.2400
Resistance levels: 1.2510, 1.2540
If the price fixes above 1.2510, GBP/USD is expected to rise. The movement is tending to 1.2540-1.2570.
An alternative could be a decrease of the GBP/USD currency pair to 1.2430-1.2400.
The USD/CAD currency pair
Technical indicators of the currency pair:
Prev Open: 1.35671
Open: 1.35601
% chg. over the last day: -0.13
Day’s range: 1.35196 – 1.35626
52 wk range: 1.2949 – 1.4668
The USD/CAD has moved down. The trading instrument has updated local lows. Loonie is currently consolidating in the range of 1.3520-1.3555. Positive dynamics in the black gold market supports the Canadian dollar. The USD/CAD currency pair is tending to further decline. We recommend paying attention to the news feed on the US economy. Positions must be opened from key levels.
The publication of important economic reports from Canada is not planned.
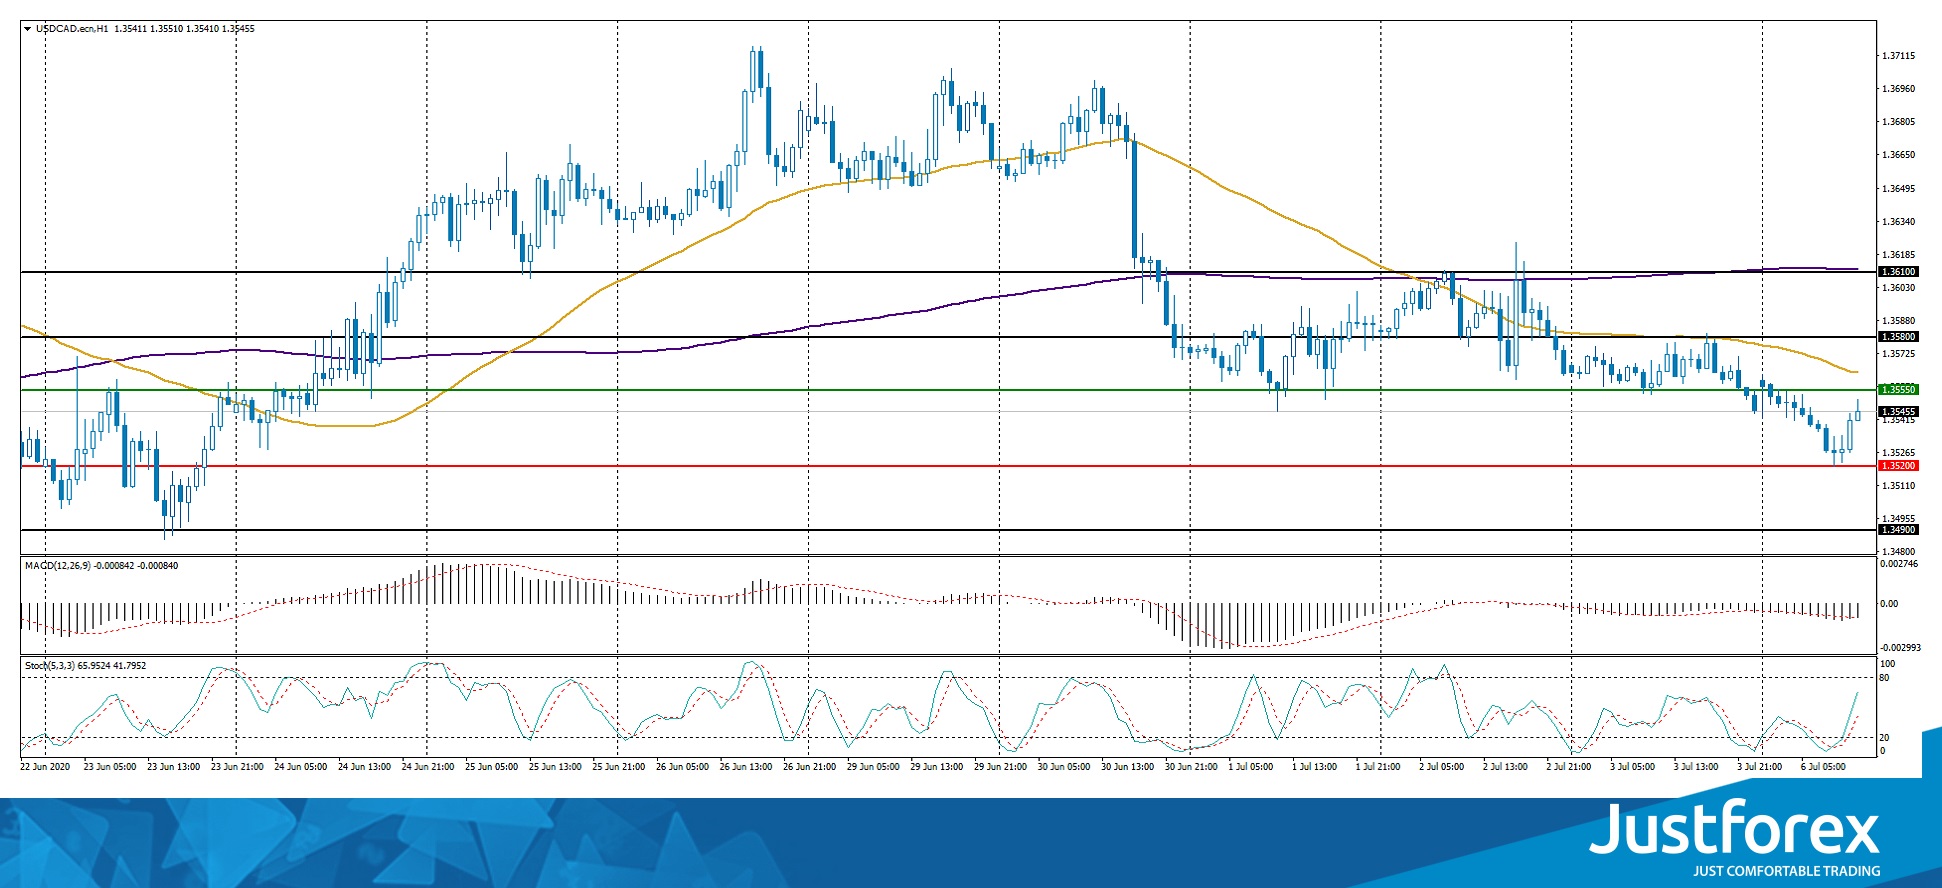
Indicators point to the power of sellers: the price has fixed below 50 MA and 100 MA.
The MACD histogram is in the negative zone, indicating bearish sentiment.
Stochastic Oscillator is in the neutral zone, the %K line is above the %D line, which gives a signal to buy USD/CAD.
Trading recommendations
Support levels: 1.3520, 1.3490
Resistance levels: 1.3555, 1.3580, 1.3610
If the price fixes below 1.3520, a further drop in the USD/CAD quotes is expected. The movement is tending to 1.3490-1.3470.
An alternative could be the growth of the USD/CAD currency pair to 1.3580-1.3610.
The USD/JPY currency pair
Technical indicators of the currency pair:
Prev Open: 107.482
Open: 107.460
% chg. over the last day: -0.01
Day’s range: 107.439 – 107.773
52 wk range: 101.19 – 112.41
The USD/JPY currency pair is still in a prolonged flat. Unidirectional trends are not observed. Investors expect additional drivers. The key support and resistance levels are 107.35 and 107.75, respectively. Today, the focus is on statistics on the US economy. We also recommend paying attention to the dynamics of yield on US government bonds. Positions must be opened from key levels.
The publication of important economic reports from Japan is not planned.
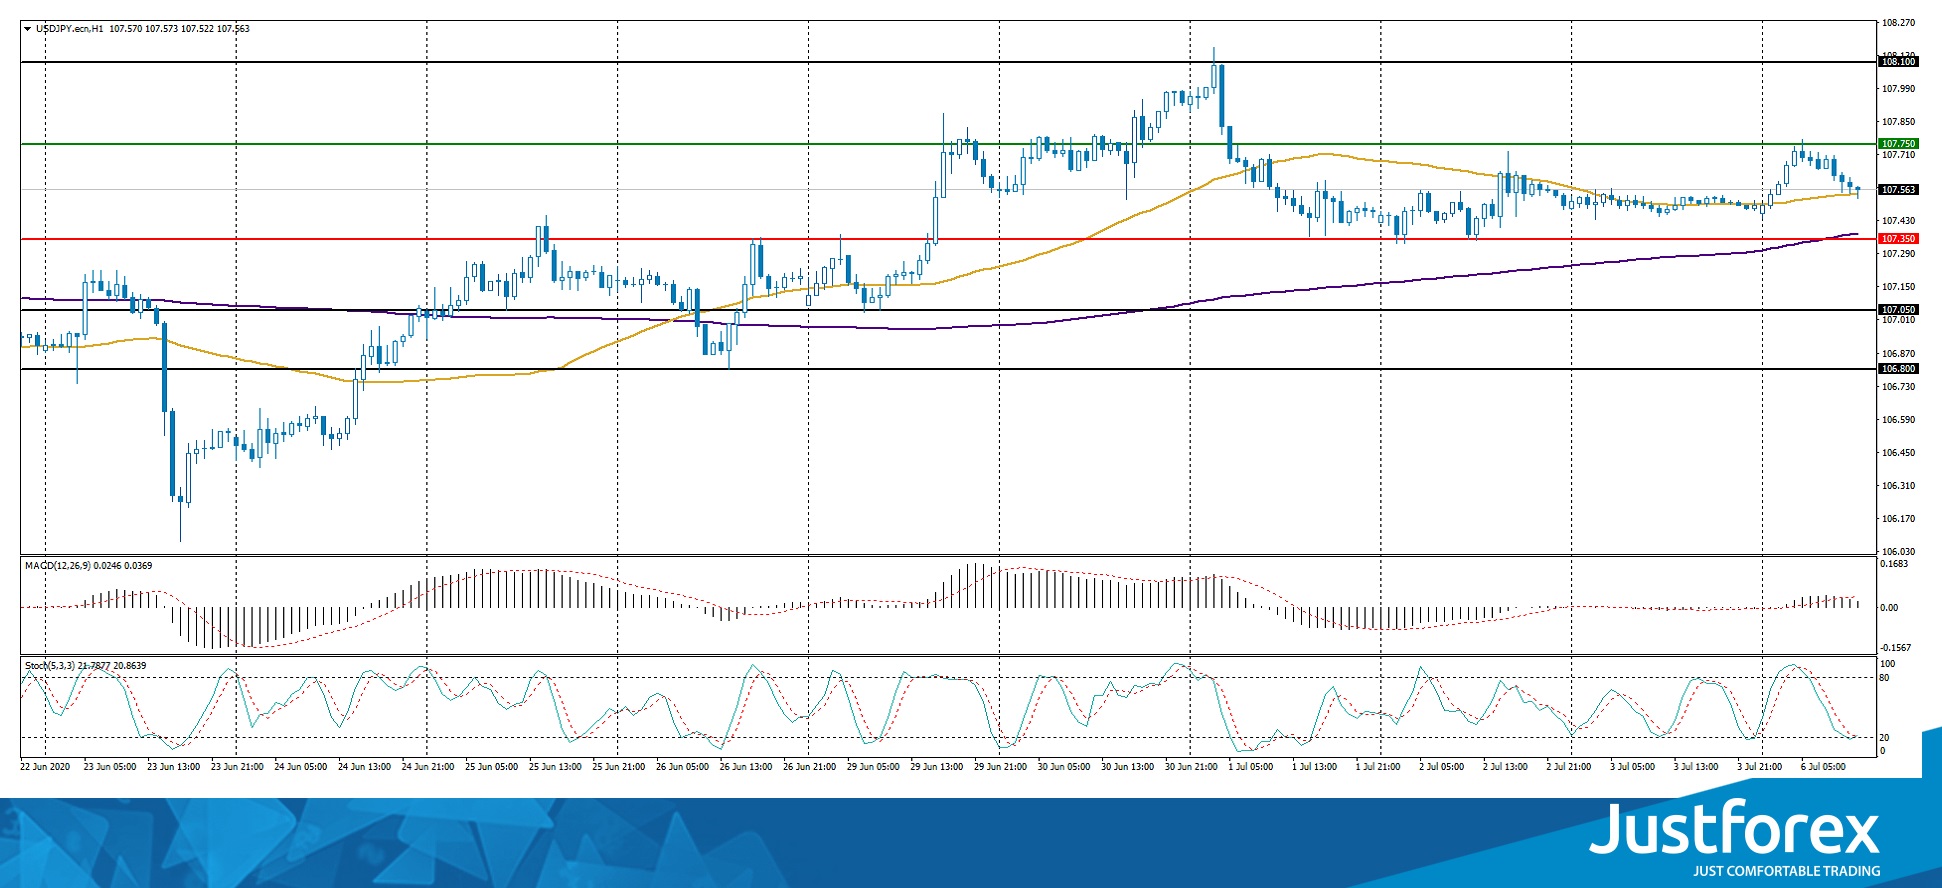
Indicators do not send accurate signals: the price has crossed 50 MA.
The MACD histogram is near the 0 mark.
Stochastic Oscillator is located near the oversold zone, the %K line has crossed the %D line. There are no signals at the moment.
Trading recommendations
Support levels: 107.35, 107.05, 106.80
Resistance levels: 107.75, 108.10
If the price fixes below 107.35, USD/JPY is expected to fall. The movement is tending to 107.00-106.70.
An alternative could be the growth of the USD/JPY currency pair to 108.00-108.30.


