
The EUR/USD currency pair
Technical indicators of the currency pair:
Prev Open: 1.13080
Open: 1.12695
% chg. over the last day: -0.33
Day’s range: 1.12627 – 1.12943
52 wk range: 1.0777 – 1.1494
The EUR/USD currency pair is in a sideways trend. Unidirectional trends are not observed. A trading instrument is consolidating in the range of 1.1260-1.1300. Demand for risky assets remains at a rather low level. Some countries have begun to apply quarantine measures again due to increased coronavirus infection. Representatives of the FOMC believe that the unemployment rate in the US will remain at a high level. Positions need to be opened from key support and resistance levels.
Today, the news feed is pretty calm. We recommend you to pay attention to the EU economic forecasts.
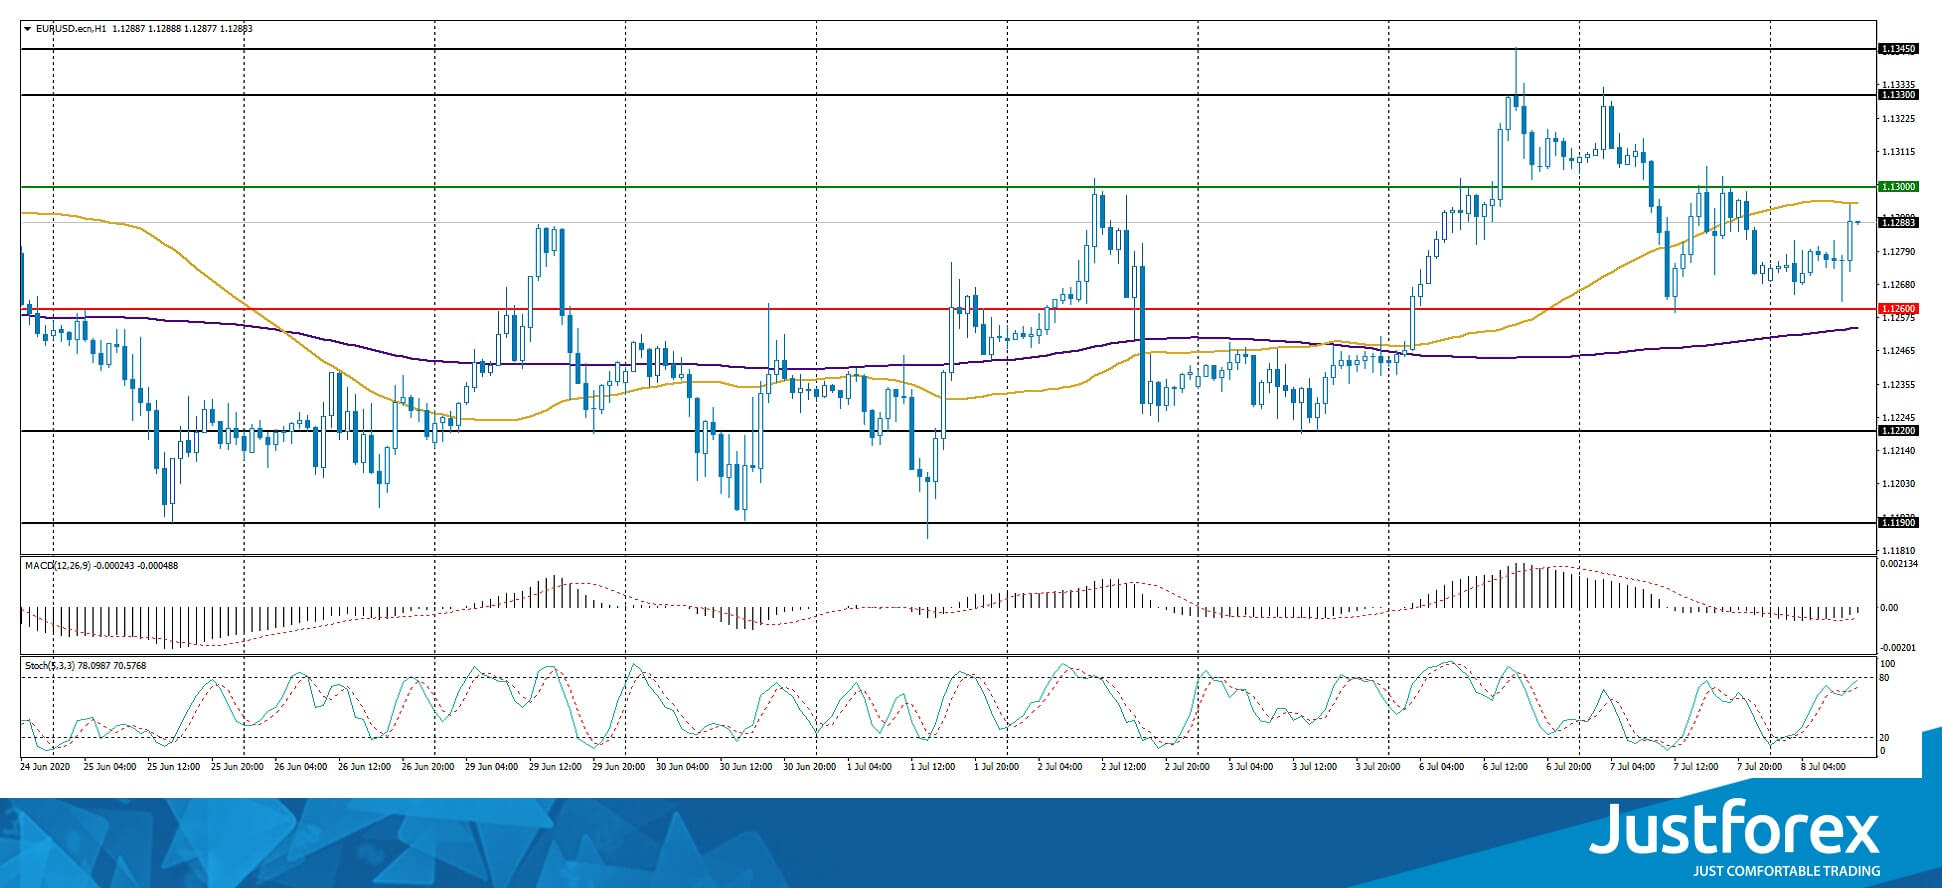
Indicators do not send accurate signals: the price has fixed between 50 MA and 100 MA.
The MACD histogram is near the 0 mark.
Stochastic Oscillator is in the neutral zone, the %K line is above the %D line, which indicates the bullish sentiment.
Trading recommendations
Support levels: 1.1260, 1.1220, 1.1190
Resistance levels: 1.1300, 1.1330, 1.1345
If the price fixes below the level of 1.1260, a drop in the EUR/USD quotes is expected. The movement is tending to the round level of 1.1200.
An alternative could be the growth of the EUR/USD currency pair to 1.1330-1.1350.
The GBP/USD currency pair
Technical indicators of the currency pair:
Prev Open: 1.24815
Open: 1.25338
% chg. over the last day: +0.39
Day’s range: 1.25318 – 1.25667
52 wk range: 1.1466 – 1.3516
On the GBP/USD currency pair, the bullish sentiment prevails. The pound sterling has set new local highs. The GBP/USD quotes have found resistance at 1.2585. The mark of 1.2530 is already a “mirror” support. Investors expect additional drivers. In the near future, a technical correction of the trading instrument is possible. Positions must be opened from key levels.
We recommend you to pay attention to the hearing of the Bank of England Monetary Policy Committee.
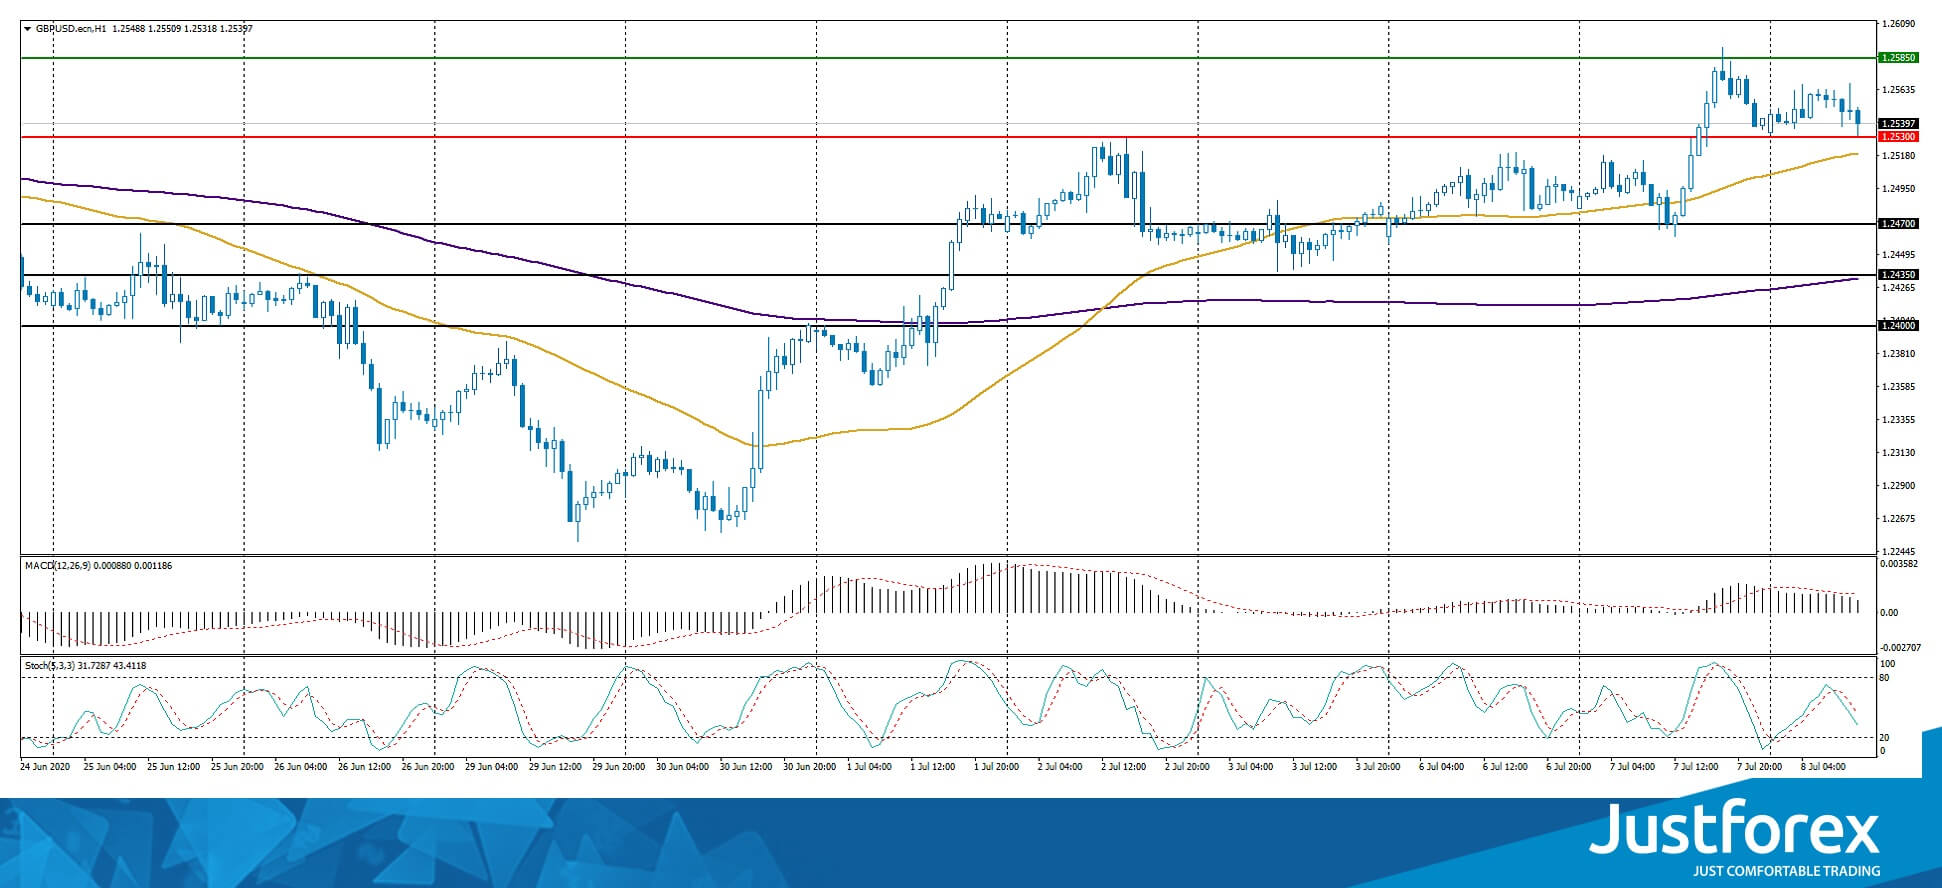
Indicators point to the power of buyers: the price has fixed above 50 MA and 100 MA.
The MACD histogram is in the positive zone, but below the signal line, which gives a weak signal to buy GBP/USD.
Stochastic Oscillator is in the neutral zone, the %K line is below the %D line, which indicates the bearish sentiment.
Trading recommendations
Support levels: 1.2530, 1.2470, 1.2435
Resistance levels: 1.2585, 1.2620
If the price fixes below 1.2530, a correction of the GBP/USD quotes is expected. The movement is tending to 1.2480-1.2450.
An alternative could be the growth of the GBP/USD currency pair to 1.2610-1.2640
The USD/CAD currency pair
Technical indicators of the currency pair:
Prev Open: 1.35324
Open: 1.35985
% chg. over the last day: +0.49
Day’s range: 1.35842 – 1.36238
52 wk range: 1.2949 – 1.4668
An ambiguous technical pattern has developed on the USD/CAD currency pair. Loonie is currently consolidating. The trading tool is testing local support and resistance levels: 1.3580 and 1.3620, respectively. The USD/CAD quotes are tending to grow. We recommend you to pay attention to the dynamics of “black gold” prices. Positions must be opened from key levels.
At 15:15 (GMT+3:00), data on housing starts in Canada will be published.
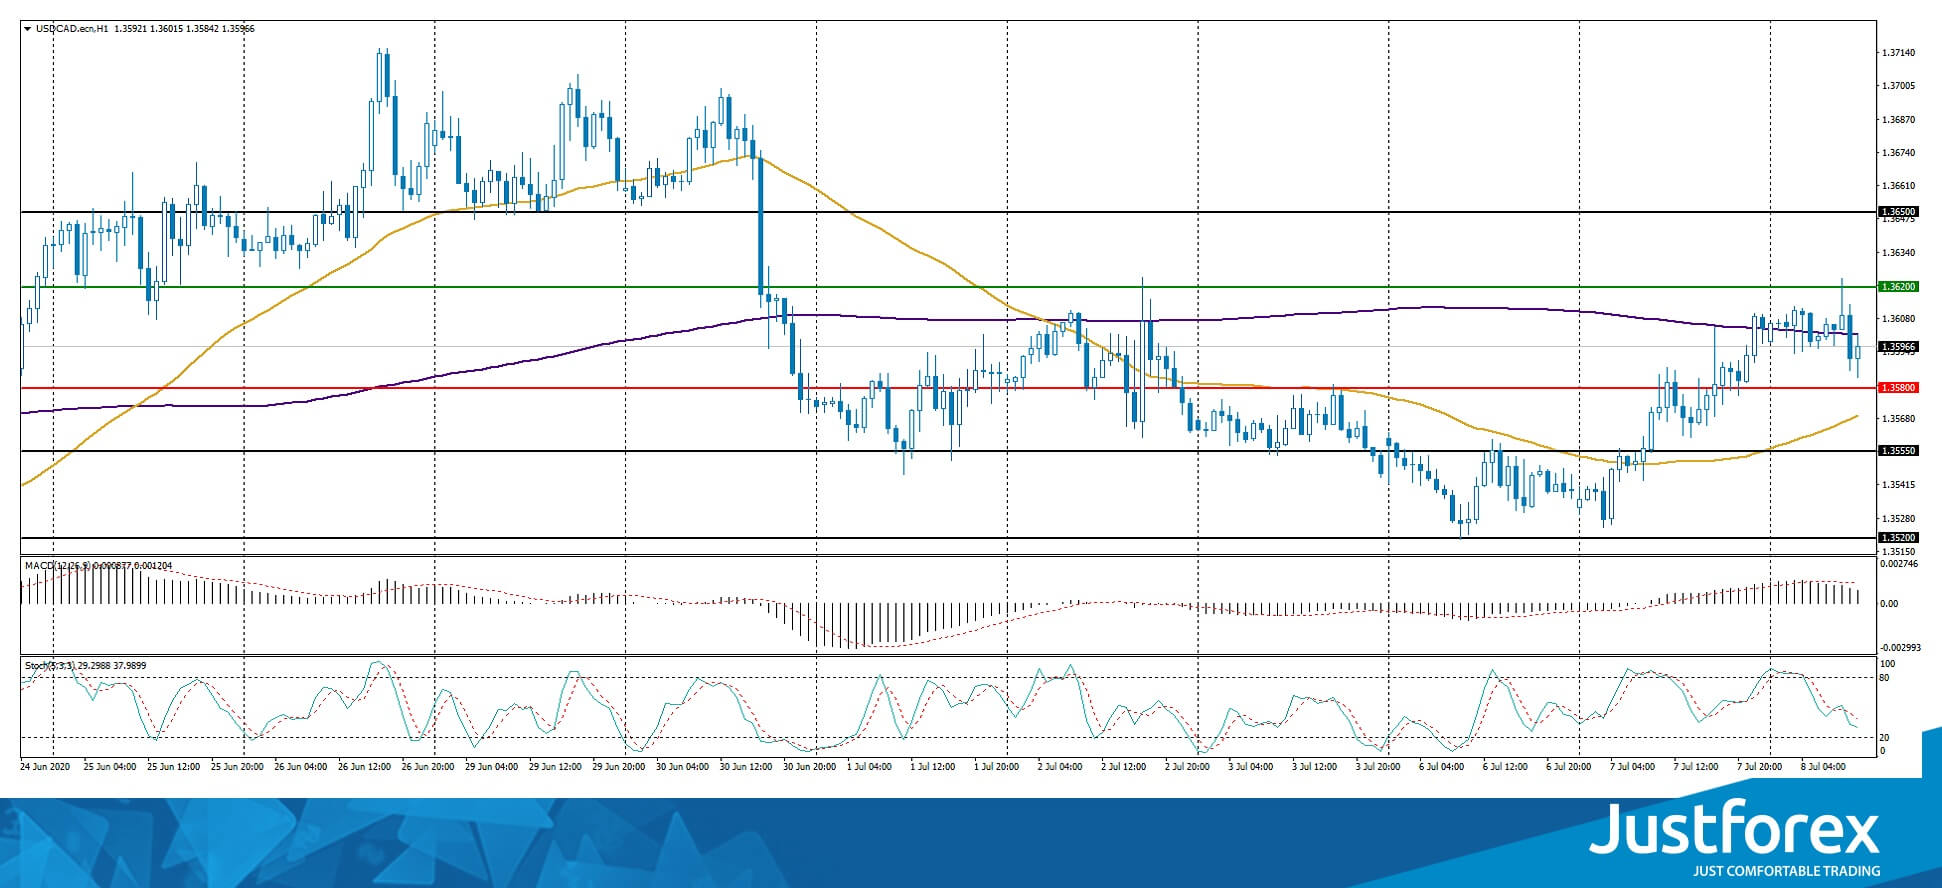
Indicators do not send accurate signals: the price has crossed 100 MA.
The MACD histogram is in the positive zone, but below the signal line, which gives a weak signal to buy USD/CAD.
Stochastic Oscillator is in the neutral zone, the %K line is below the %D line, which indicates a bearish sentiment.
Trading recommendations
Support levels: 1.3580, 1.3555, 1.3520
Resistance levels: 1.3620, 1.3650
If the price fixes above 1.3620, further growth of the USD/CAD quotes is expected. The movement is tending to 1.3650-1.3670.
An alternative could be a decrease in the USD/CAD currency pair to 1.3555-1.3530.
The USD/JPY currency pair
Technical indicators of the currency pair:
Prev Open: 107.347
Open: 107.544
% chg. over the last day: +0.14
Day’s range: 107.427 – 107.710
52 wk range: 101.19 – 112.41
The USD/JPY currency pair is still in a prolonged flat. Unidirectional trends are not observed. Local levels of support and resistance are still: 107.45 and 107.75, respectively. Participants in financial markets expect additional drivers. We recommend you to pay attention to the dynamics of yield on US government bonds. Positions must be opened from key levels.
The news feed on the Japanese economy is quite calm.
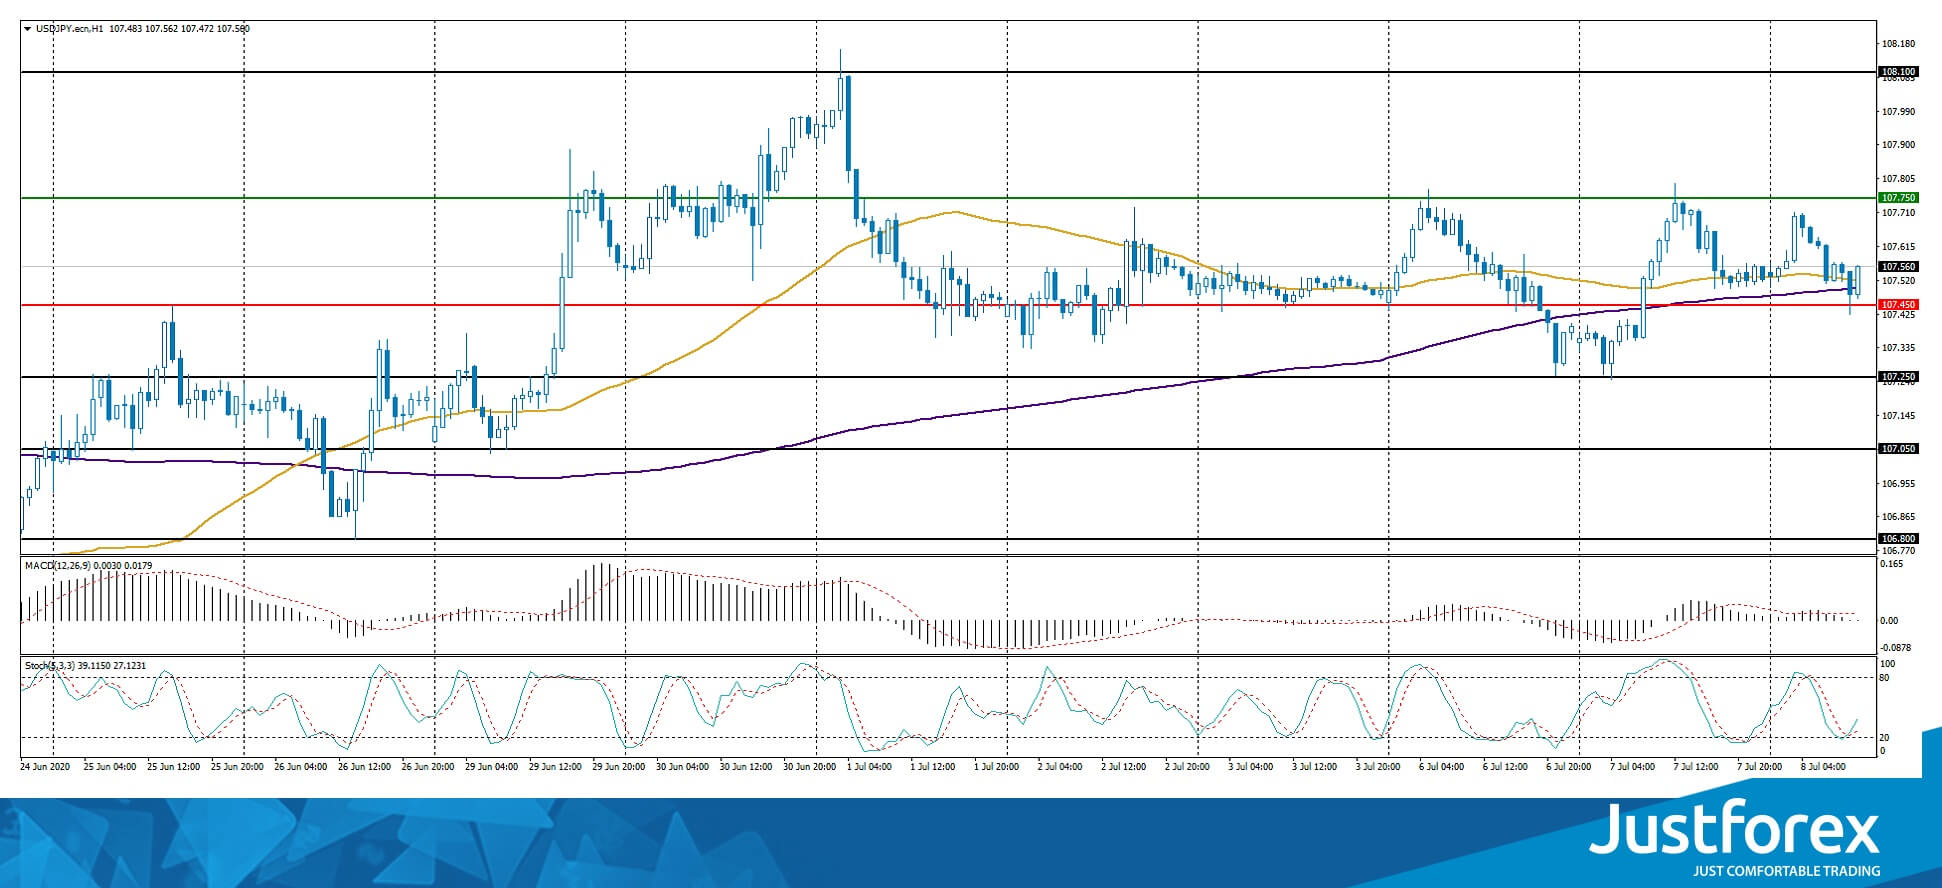
Indicators do not send accurate signals: the price has crossed 50 MA and 100 MA.
The MACD histogram is near the 0 mark.
Stochastic Oscillator is in the neutral zone, the %K line is above the %D line, which indicates the bullish sentiment.
Trading recommendations
Support levels: 107.45, 107.25, 107.05
Resistance levels: 107.75, 108.10
If the price fixes above 107.75, USD/JPY is expected to rise. The movement is tending to 108.00-108.25.
An alternative could be a decrease in the USD/JPY currency pair to 107.25-107.00.


