
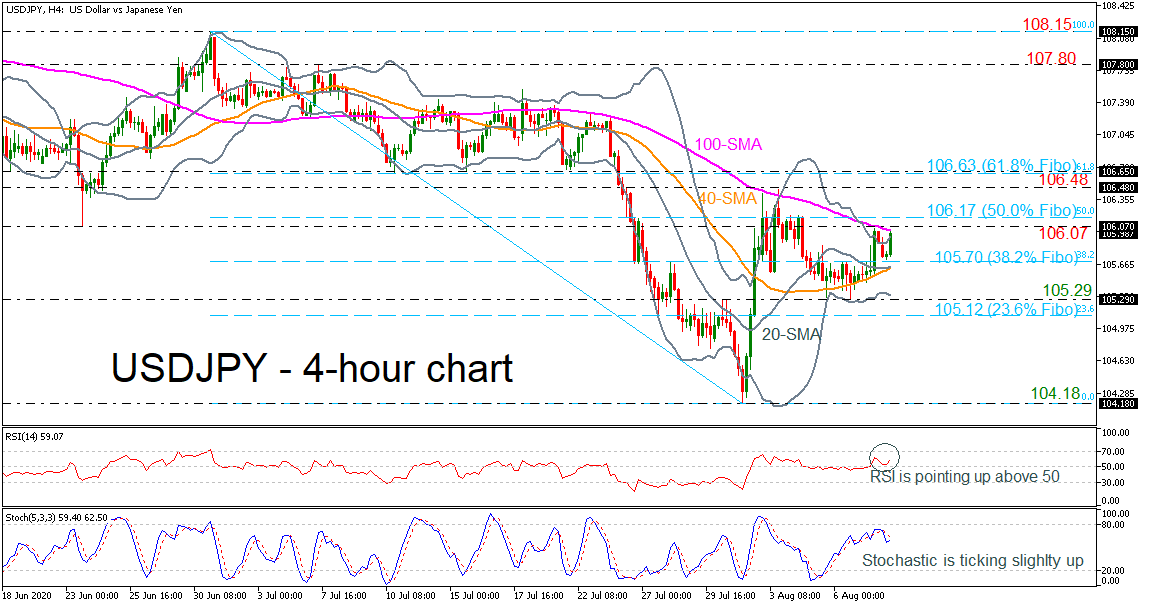
USDJPY is testing the 100-period simple moving average (SMA) in the 4-hour chart and the upper boundary of the Bollinger band, remaining around the 106.00 handle. The RSI indicator is pointing slightly up in the positive territory, while the stochastic oscillator is in process to post the bullish crossover within the %K and %D lines below the 80 level.
A successful jump above the 106.07 resistance could open the way for the 50.0% Fibonacci retracement level of the down leg from 108.15 to 104.18 at 106.17. Above that, the market could reach the 106.48 – 106.63 resistance area, which encapsulates the 61.8% Fibonacci. More aggressive buying interest could open the door for the 107.80 barrier.
Alternatively, a decline below the 38.2% Fibonacci of 105.70, the mid-level of the Bollinger band and the 40-period SMA could rest around the lower Bollinger band, which coincides with the 105.29 support. Below that, the 105.12 support, being the 23.6% Fibonacci mark could act as a strong level against the bears.
In the short-term timeframe, USDJPY seems to be neutral as it fails to have a clear tendency after the rebound on the 104.18 support.


