
The EUR/USD currency pair
Technical indicators of the currency pair:
Prev Open: 1.18763
Open: 1.17868
% chg. over the last day: -0.75
Day’s range: 1.17597 – 1.18007
52 wk range: 1.0777 – 1.1781
The EUR/USD currency pair has been declining after a prolonged growth. The trading instrument has updated local lows. The US published rather optimistic statistics on the labor market for July, which caused renewed demand for the greenback. Financial market participants also monitor the progress of negotiations in Washington on new measures to stimulate the American economy. At the moment, EUR/USD quotes are consolidating in the range of 1.1755-1.1800. Positions should be opened from these marks.
The news feed on 2020.08.10:
JOLTS job openings in the US at 17:00 (GMT+3:00).
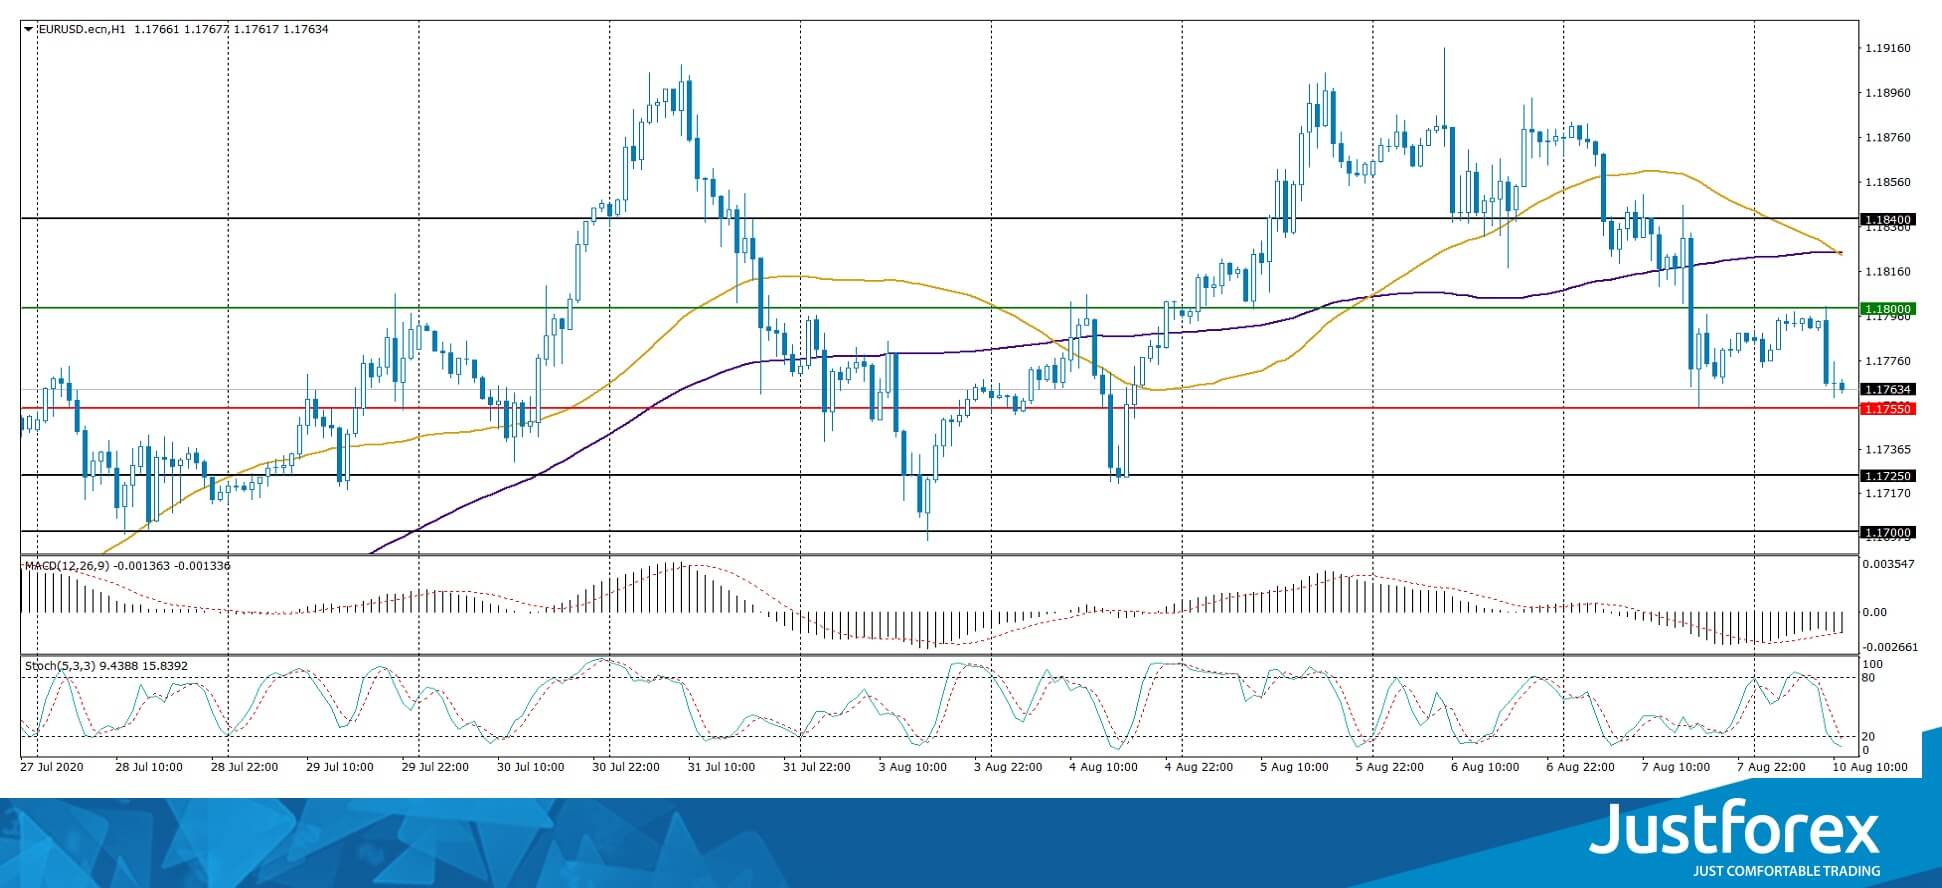
Indicators do not give accurate signals: 50 MA has crossed 100 MA.
The MACD histogram is in the negative zone, which indicates the bearish sentiment.
Stochastic Oscillator is in the oversold zone, the %K line is below the %D line, which gives a weak signal to sell EUR/USD.
Trading recommendations
Support levels: 1.1755, 1.1725, 1.1700
Resistance levels: 1.1800, 1.1840
If the price fixes below 1.1755, EUR/USD quotes are expected to fall further. The movement is tending to the round level of 1.1700.
An alternative could be the growth of the EUR/USD currency pair to 1.1840-1.1860.
The GBP/USD currency pair
Technical indicators of the currency pair:
Prev Open: 1.31378
Open: 1.30535
% chg. over the last day: -0.73
Day’s range: 1.30373 – 1.30763
52 wk range: 1.1466 – 1.3516
GBP/USD quotes have been declining after prolonged growth. The British pound has updated local lows. The demand for greenback has been resumed. Investors assess a report on the US labor market for July. At the moment, the local support and resistance levels are 1.3040 and 1.3100, respectively. The trading instrument has the potential for further correction. Positions should be opened from key levels.
The news feed on the UK economy is calm.
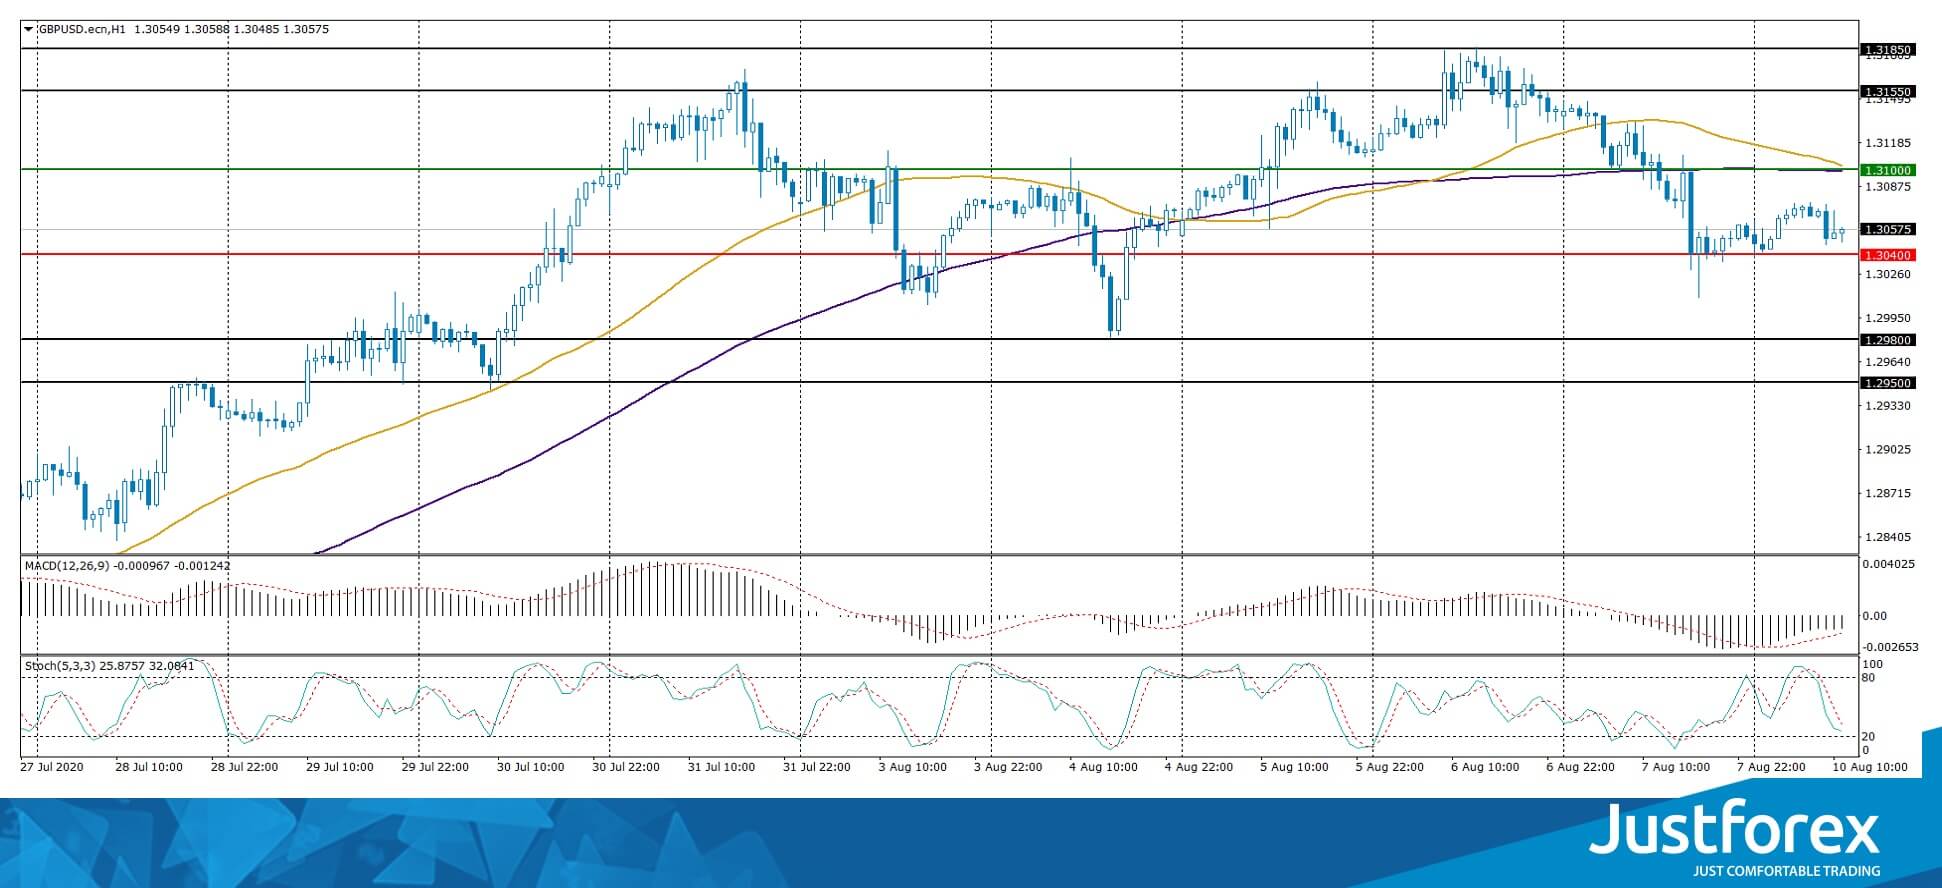
Indicators do not give accurate signals: 50 MA has crossed 100 MA.
The MACD histogram is in the negative zone, but above the signal line, which gives a weak signal to sell GBP/USD.
Stochastic Oscillator is in the neutral zone, the %K line is below the %D line, which indicates the bearish sentiment.
Trading recommendations
Support levels: 1.3040, 1.2980, 1.2950
Resistance levels: 1.3100, 1.3155, 1.3185
If the price fixes below 1.3040, further correction of GBP/USD quotes is expected. The movement is tending to 1.3000-1.2960.
An alternative could be the growth of the GBP/USD currency pair to 1.3140-1.3170.
The USD/CAD currency pair
Technical indicators of the currency pair:
Prev Open: 1.32863
Open: 1.33890
% chg. over the last day: +0.59
Day’s range: 1.33669 – 1.33947
52 wk range: 1.2949 – 1.4668
The bullish sentiment prevails on the USD/CAD currency pair. The trading instrument has updated local highs again. The loonie is currently consolidating. Local support and resistance levels are 1.3365 and 1.3400, respectively. USD/CAD quotes have the potential for further growth. Positions should be opened from key levels.
The news feed on Canada’s economy is calm.
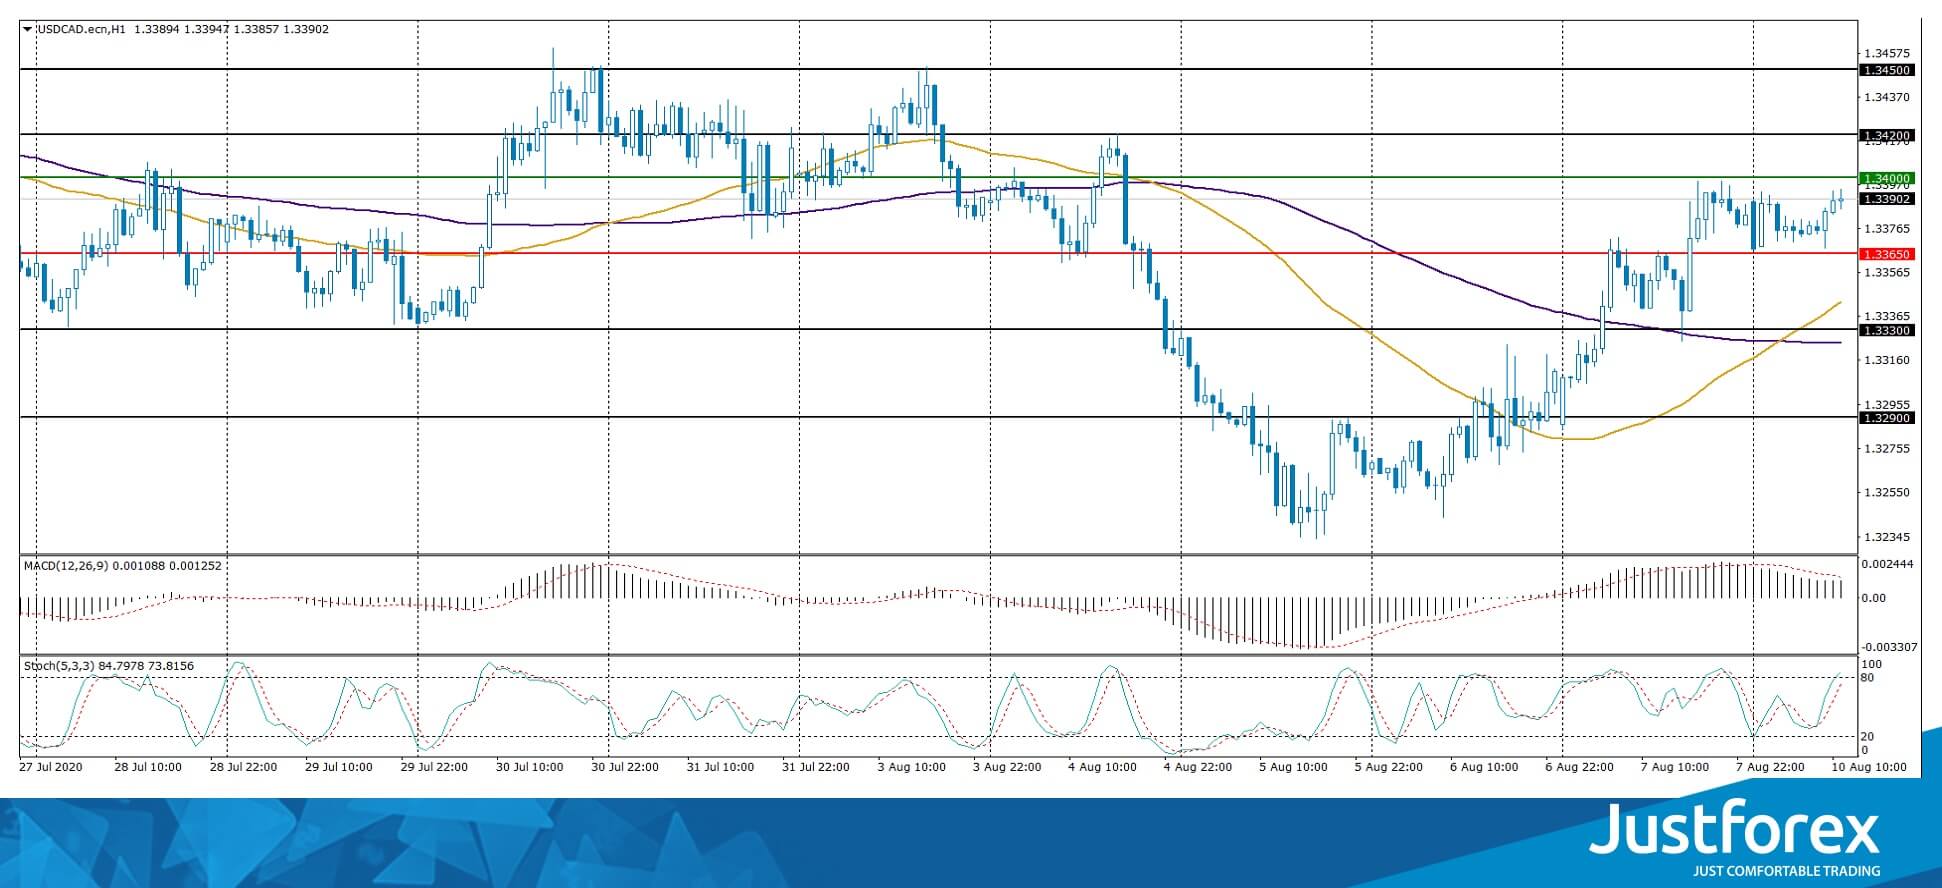
Indicators signal the power of buyers: the price has fixed above 50 MA and 100 MA.
The MACD histogram is in the positive zone, which indicates the bullish sentiment.
Stochastic Oscillator is in the neutral zone, the %K line is above the %D line, which also gives a signal to buy USD/CAD.
Trading recommendations
Support levels: 1.3365, 1.3330, 1.3290
Resistance levels: 1.3400, 1.3420, 1.3450
If the price fixes above 1.3400, further growth of USD/CAD quotes is expected. The movement is tending to 1.3430-1.3460.
An alternative could be a decline in the USD/CAD currency pair to 1.3330-1.3310.
The USD/JPY currency pair
Technical indicators of the currency pair:
Prev Open: 105.496
Open: 105.842
% chg. over the last day: +0.36
Day’s range: 105.480 – 105.641
52 wk range: 101.19 – 112.41
The USD/JPY currency pair has been growing after a prolonged consolidation. The trading instrument has updated local highs. At the moment, the key support and resistance levels are 105.70 and 106.20, respectively. USD/JPY quotes have the potential for further growth. We recommend paying attention to the dynamics of US government bonds yield. Positions should be opened from key levels.
Japan’s financial markets are closed due to the holiday.
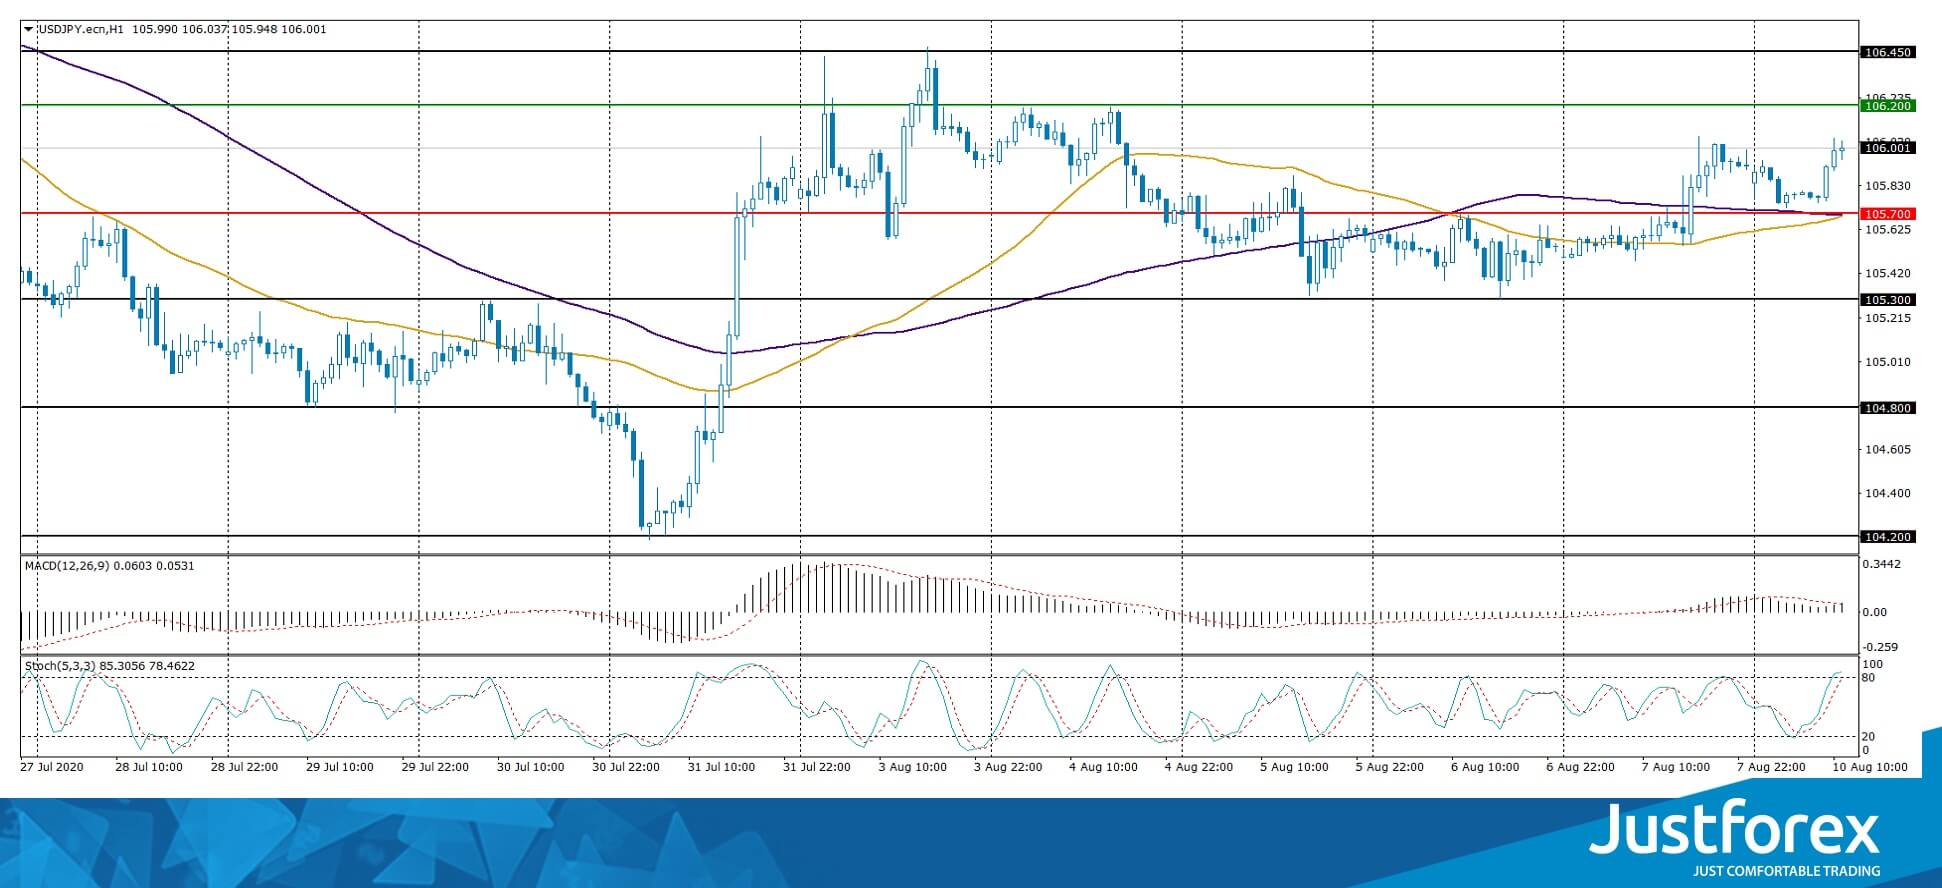
Indicators do not give accurate signals: 50 MA has crossed 100 MA.
The MACD histogram has started growing, which indicates the development of an uptrend.
Stochastic Oscillator is in the neutral zone, the %K line is above the %D line, which gives a signal to buy USD/JPY.
Trading recommendations
Support levels: 105.70, 105.30, 104.80
Resistance levels: 106.20, 106.45
If the price fixes above 106.20, further growth in the USD/JPY quotes is expected. The movement is tending to 106.50-106.80.
An alternative could be a decrease in the USD/JPY currency pair to 105.40-105.20.


