
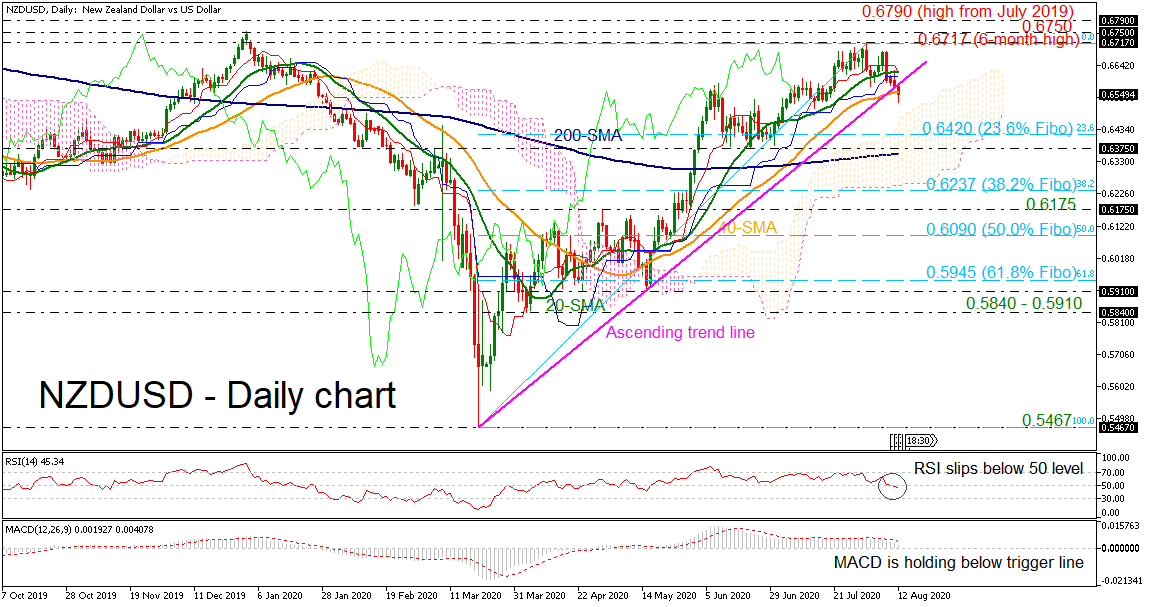
NZDUSD has declined beneath the five-month ascending trend line and the 40-day simple moving average (SMA), indicating a downside pullback. The momentum indicators are losing ground as the RSI is edging below the 50 level and the MACD is slipping below the trigger line in the positive zone. The Ichimoku red Tenkan-sen line is pointing down, approaching the blue Kijun-sen line.
More downside pressure could send the market towards the 23.6% Fibonacci retracement level of the up leg from 0.5467 to 0.6717 at 0.6420, remaining inside the Ichimoku cloud. Below that, the pair could challenge the 0.6375 support, which holds near the 200-day SMA. Clearing these levels, the 38.2% Fibonacci of 0.6237 could attract attention.
On the other side, the price could hit the six-month peak of 0.6717 ahead of the 0.6750 resistance, registered on December 2019. Even higher, NZDUSD could turn to the focus at the 0.6790 barrier, reached on July 2019.
Summarizing, a daily close beneath the rising trend line could open the way for a neutral bias in the short-term timeframe. A drop beneath the 0.6175 support could switch the outlook to bearish.


