
After Gold (XAU/USD) reached a new all-time high earlier in August 2020, the commodity has been under heavy bearish pressure. Is the rally on course to continue or is it time for a reversal?
Price Charts and Technical Analysis
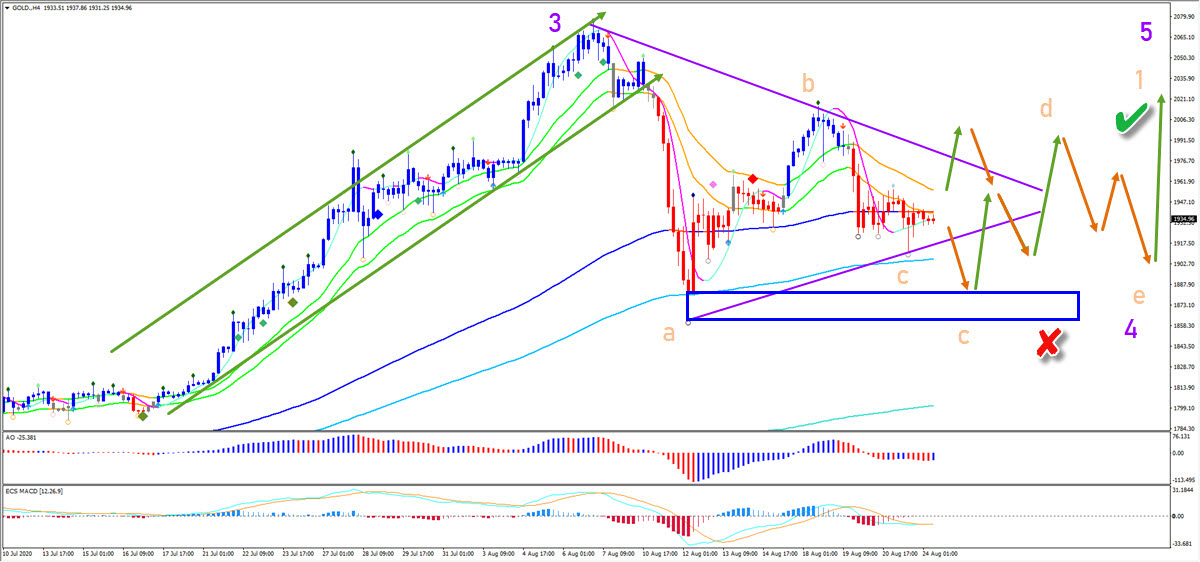
The XAU/USD chart broke above the previous high and the psychological $2,000 round level with quite an ease. But the subsequent drop showed that plenty of investors took (some) profit at the new high. The strong bounce at the long-term moving averages, however, is increasing the odds of a contracting triangle pattern.
For the triangle to remain intact and valid, price action may not break below the bottom of the wave otherwise it becomes invalid (red x). A second bullish bounce could confirm the wave C. After that, two more bounces that fail to break the high and low could finalize the ABCDE triangle. All in all, the triangle could be a wave 4 (purple) pattern.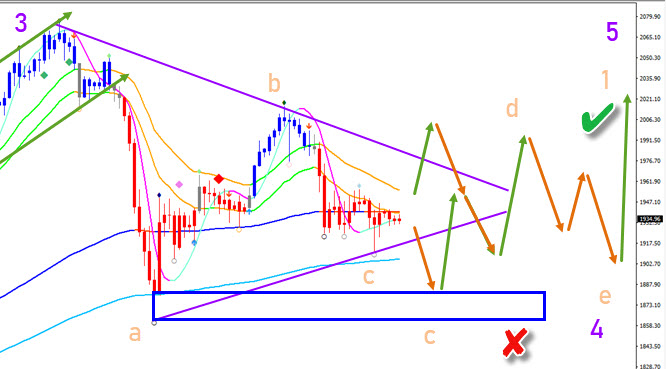


