
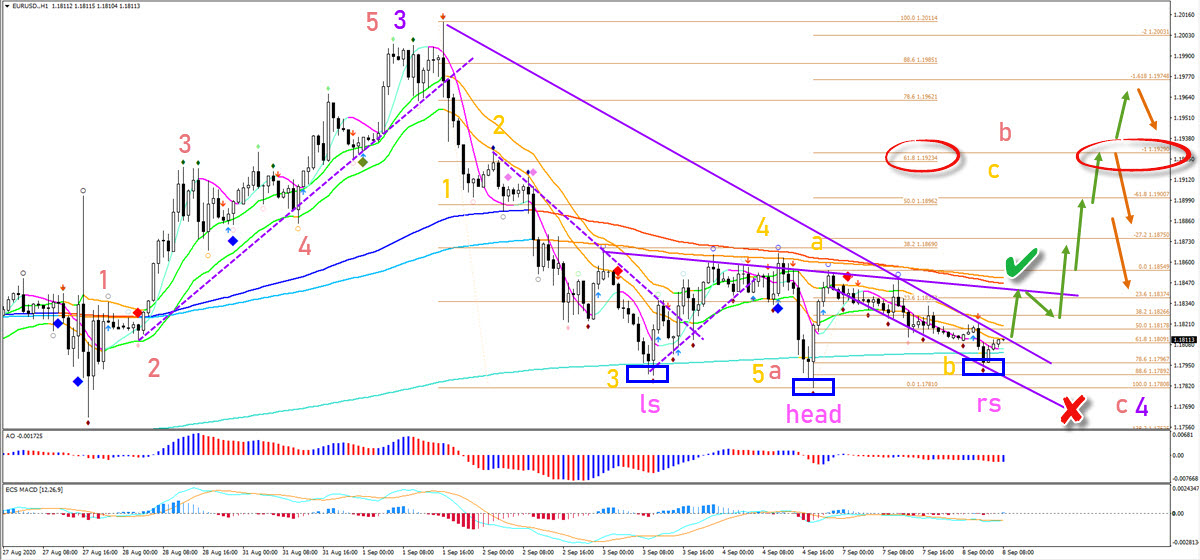
The EUR/USD is testing a critical support zone. A bullish bounce could confirm an inverted head and shoulders pattern (blue boxes). The break below support or above resistance will be a key aspect for the direction of the next price swing.
Price Charts and Technical Analysis
The EUR/USD bullish rebound at the Fibonacci levels could confirm a wave B (orange). But price action must stay above the 100% Fib level, otherwise the ABC zigzag pattern is invalid (red x). A breakout above the resistance trend lines and long-term moving averages would confirm the bullish breakout. This could also confirm the wave C (orange) of a larger wave B (red). Price is expected to respect the Fibonacci targets.
In the image below traders can also see the 4 hour perspective including volume profile. The current level has seen huge levels of volume. This increases the chance of price using it as a support zone. But if a bearish breakout does take place, then there is plenty of space to fall towards 1.17 and the larger 23.6% Fibonacci level of wave 4 (pink). A break through that Fib means that price can extend its fall towards the 38.2% Fib and 1.15 round level. A bullish bounce could target the head and shoulders level (red boxes)


