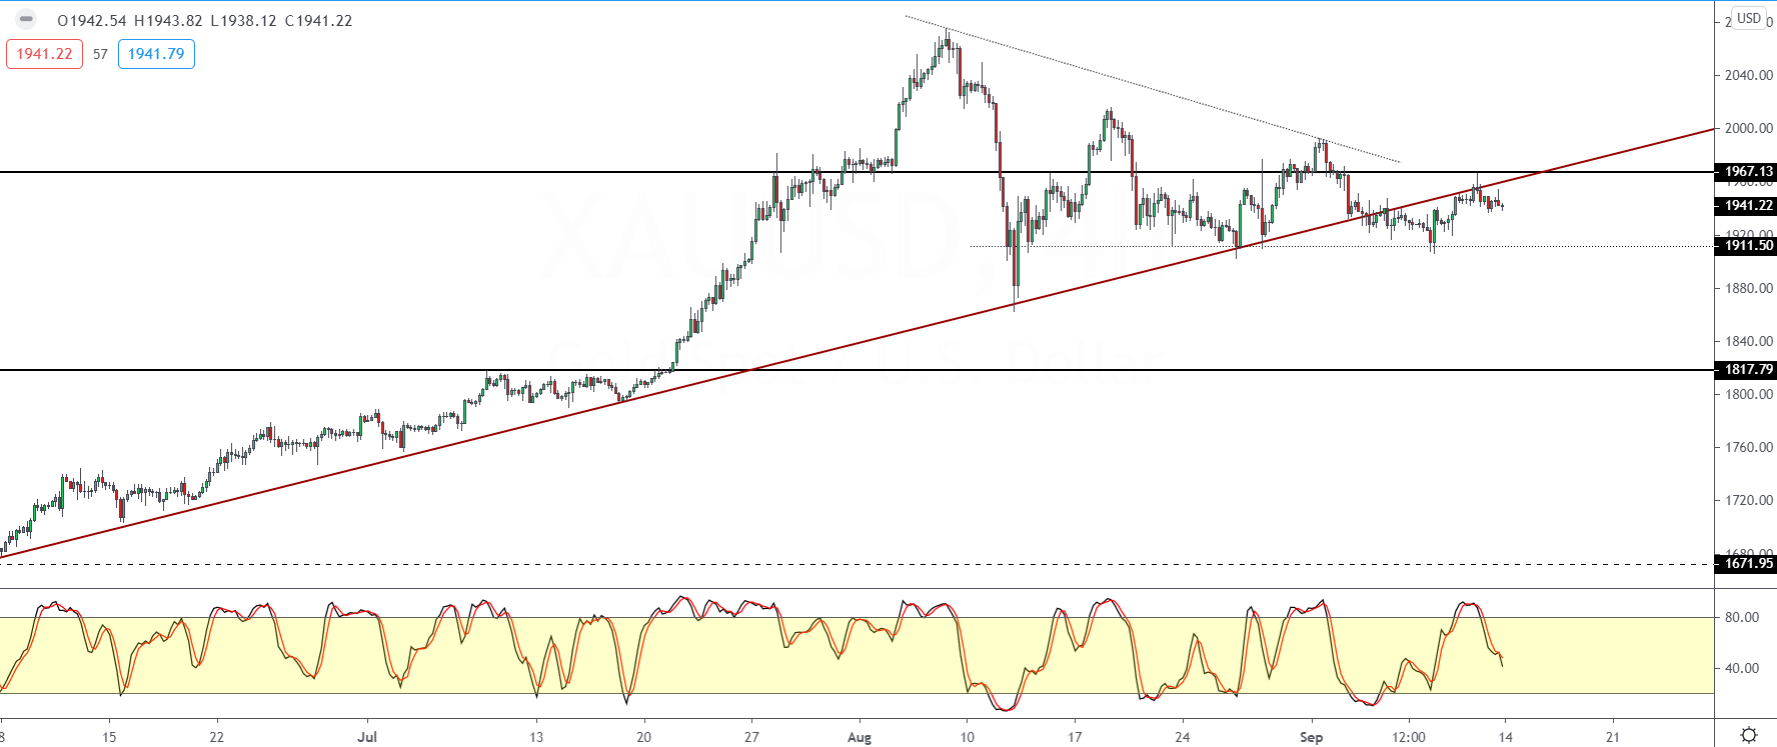
The precious metal is consolidating just a few points below the 1967 technical resistance.
With the support formed near the 1911.50 handle, the sideways range could continue.
Price action on the daily chart shows a gradual move lower, but prices have failed to make any significant lows.
This could mean that a possible breakout could occur. The Fed’s meeting this week could prove to be the catalyst.
Watch how prices unfold near the 1900 – 1911.50 region.
If gold loses this support, then we expect a correction down to the 1817.80 level of support next.