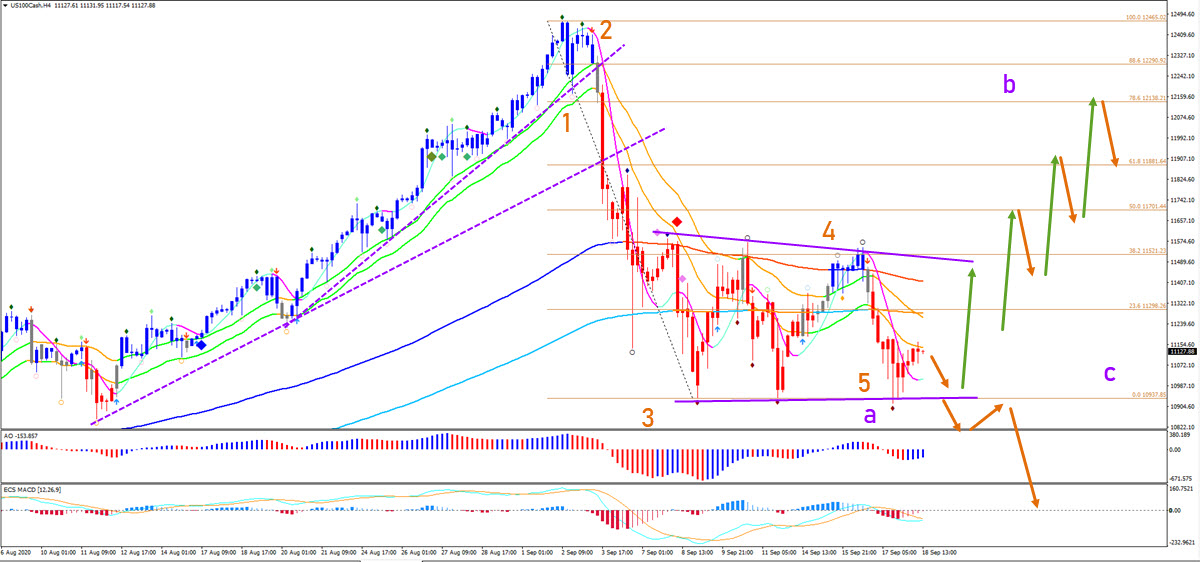
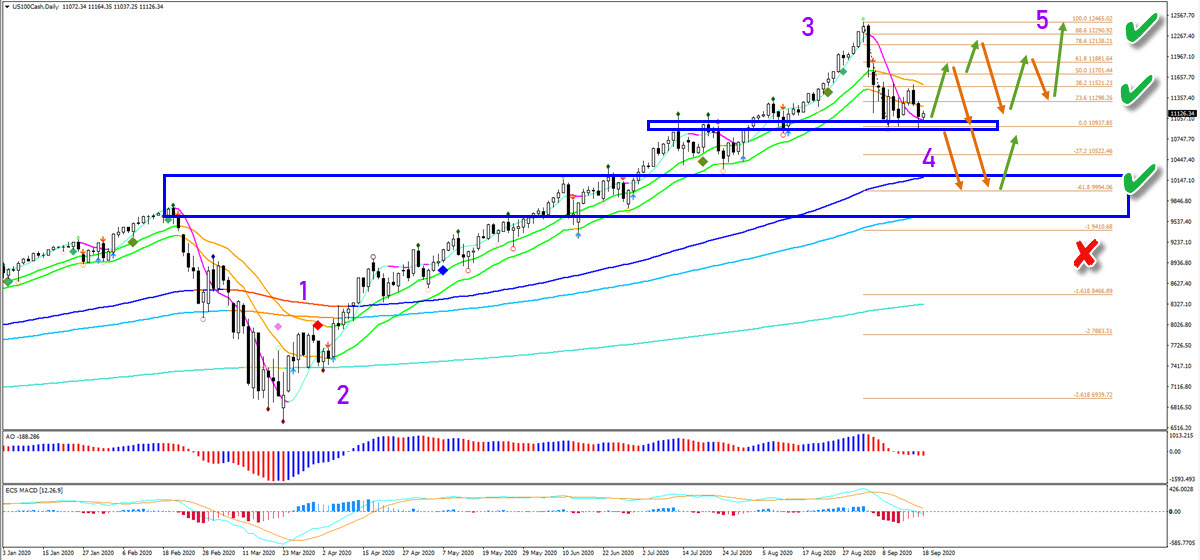
The Nasdaq (NQ 100) is testing the support zone for the 3rd time (top blue box). Will the NQ100 index finally make a bullish bounce? Or will the pullback retrace deeper towards the next support zone
Price Charts and Technical Analysis
The NQ 100 is likely to make a bullish bounce in this zone due to the strong confluence of support. A bullish bounce would aim for the Fibonacci retracement levels. A push to and reversal at the 50-61.8% Fibonacci retracement levels, however, could indicate a bearish reversal. A move up into the 78.6% indicates a triangle chart pattern instead and later on, an uptrend continuation as well. Only a break below the bottom could increase the chance of price reaching the next support zone (lower blue box) and the -61.8% Fibonacci target. A break below the -1% Fib invalidates the current uptrend.
The current momentum is down according to our Elliott Wave software (red candles) but there is a potential triple reversal chart pattern in play. Only a break below the bottom could actually lead to a larger downtrend. Otherwise a mild pullback could confirm a bullish reversal and breakout towards the Fibonacci resistance levels