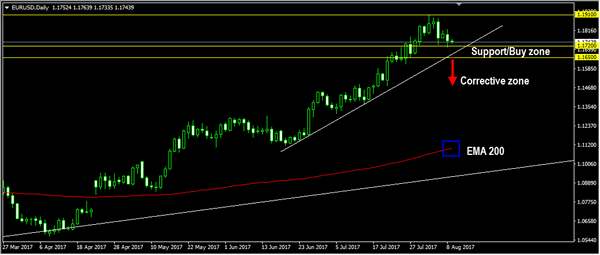
EURUSD
The EURUSD had a bearish momentum yesterday bottomed at 1.1715 but closed a little bit higher at 1.1752. The bias is bearish in nearest term testing the minor trend line support as you can see on my daily chart below which is a good place to buy with a tight stop loss below 1.1650 support area. Immediate resistance is seen around 1.1785. A clear break above that area could trigger further bullish pressure testing 1.1820/50 area. Overall I remain bullish and price is still moving above the daily EMA 200, but a clear break below 1.1650 key support would activate my neutral mode as price enters a corrective zone.
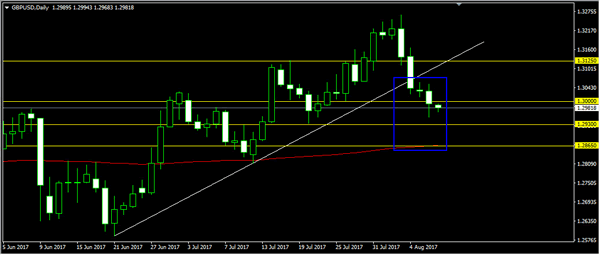
GBPUSD
The GBPUSD had a bearish momentum yesterday bottomed at 1.2952 and closed just below 1.3000 resistance. The bias is bearish in nearest term testing 1.2930 – 1.2865 region. Immediate resistance is seen around 1.3050. A clear break above that area could lead price to neutral zone in nearest term testing 1.3100/25 region which need to be clearly broken to the upside to reactivate my bullish mode retesting 1.3265 region or higher.
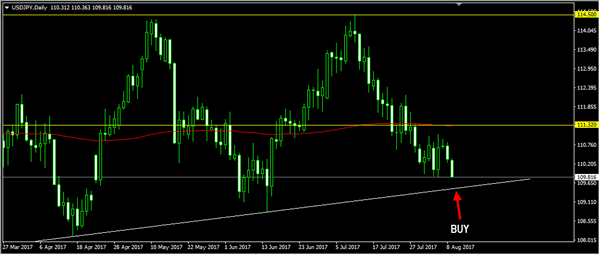
USDJPY
The USDJPY had a bearish momentum yesterday bottomed at 110.25 and hit 109.79 earlier today in Asian session. The bias is bearish in nearest term testing the trend line support and 109.50/00 region which remains a good place to buy with a tight stop loss. Immediate resistance is seen around 110.35. A clear break above that area could lead price to neutral zone in nearest term testing 111.00 region. On the downside, a clear break and daily close below 109.00/50 would activate my bearish mode.
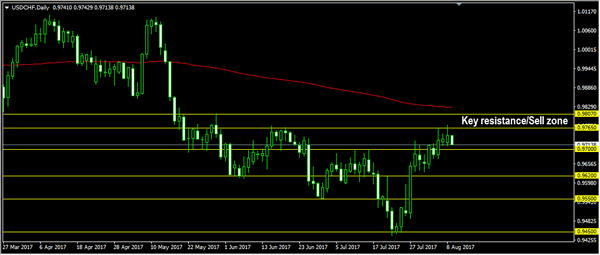
USDCHF
The USDCHF attempted to push higher yesterday topped at 0.9772 but closed lower at 0.9740 and hit 0.9705 earlier today in Asian session. Overall price is still in a bullish phase but still respects 0.9765 – 0.9807 key resistance. The bias is bearish in nearest term testing 0.9660 – 0.9620 area. Immediate resistance is seen around 0.9742 (current high). A clear break above that area could lead price to neutral zone in nearest term retesting 0.9765 – 0.9807 key resistance which remains a good place to sell.