
The EUR/USD currency pair
Technical indicators of the currency pair:
Prev Open: 1.17332
Open: 1.17600
% chg. over the last day: +0.22
Day’s range: 1.17587 – 1.17817
52 wk range: 1.0637 – 1.2012
The greenback shows a variety of trends against its main competitors. At the moment, EUR/USD quotes are consolidating. The euro is testing local support and resistance levels: 1.1760 and 1.1780, respectively. Investors assess the controversial comments by US President Donald Trump concerning the new stimulus package. According to the FOMC minutes, the Fed plans to keep interest rates at current levels for a long time. We recommend opening positions from key levels.
The news feed on 2020.10.08:
ECB monetary policy statement at 14:30 (GMT+3:00);
Initial jobless claims at 15:30 (GMT+3:00).
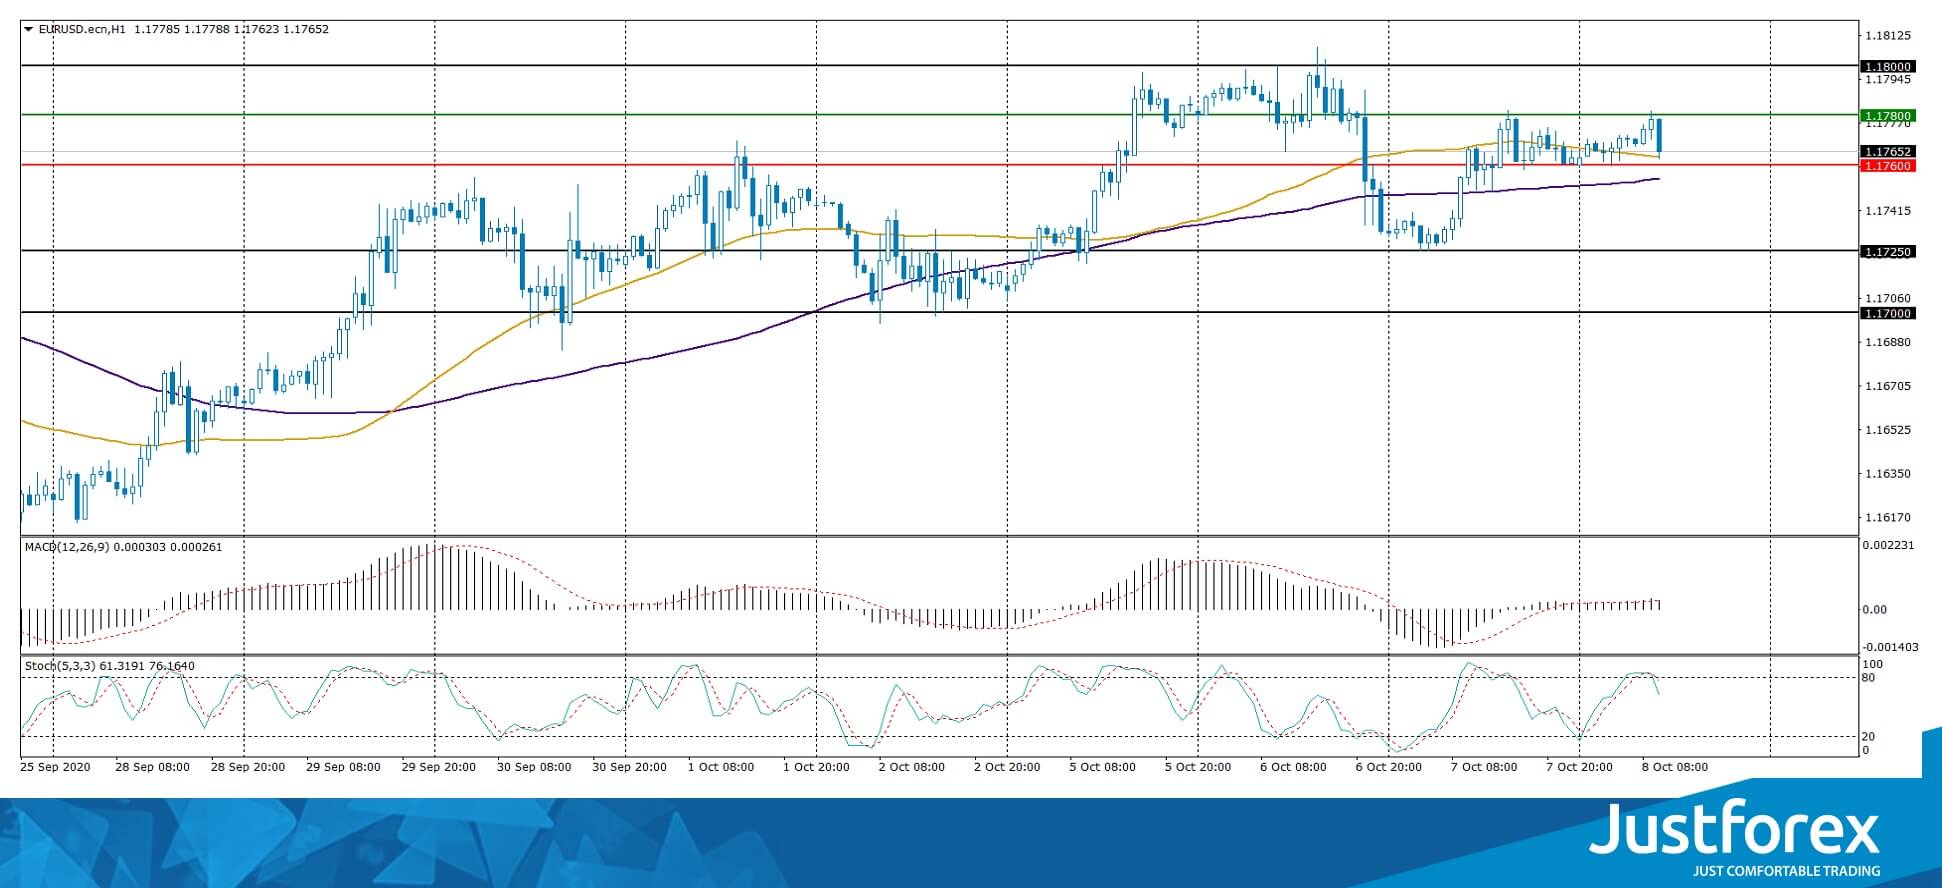
Indicators do not give accurate signals: the price has crossed the 50 MA.
The MACD histogram is in the positive zone, which indicates the bullish sentiment.
Stochastic Oscillator is located near the overbought zone, the %K line has crossed the %D line. There are no signals at the moment.
Trading recommendations
Support levels: 1.1760, 1.1725, 1.1700
Resistance levels: 1.1780, 1.1800, 1.1850
If the price fixes below 1.1760, EUR/USD quotes are expected to fall. The movement is tending to 1.1725-1.1700.
An alternative could be the growth of the EUR/USD currency pair to 1.1800-1.1840.
The GBP/USD currency pair
Technical indicators of the currency pair:
Prev Open: 1.28669
Open: 1.29107
% chg. over the last day: +0.32
Day’s range: 1.29060 – 1.29667
52 wk range: 1.1409 – 1.3516
The bullish sentiment prevails on the GBP/USD currency pair. The British pound has updated local highs. At the moment, the trading instrument is consolidating in the range of 1.2930-1.2975. Further growth of GBP/USD quotes is possible. The Brexit talks and a new stimulus package in the US Congress are in the spotlight. Positions should be opened from key levels.
We recommend paying attention to the speech by the Bank of England Governor.
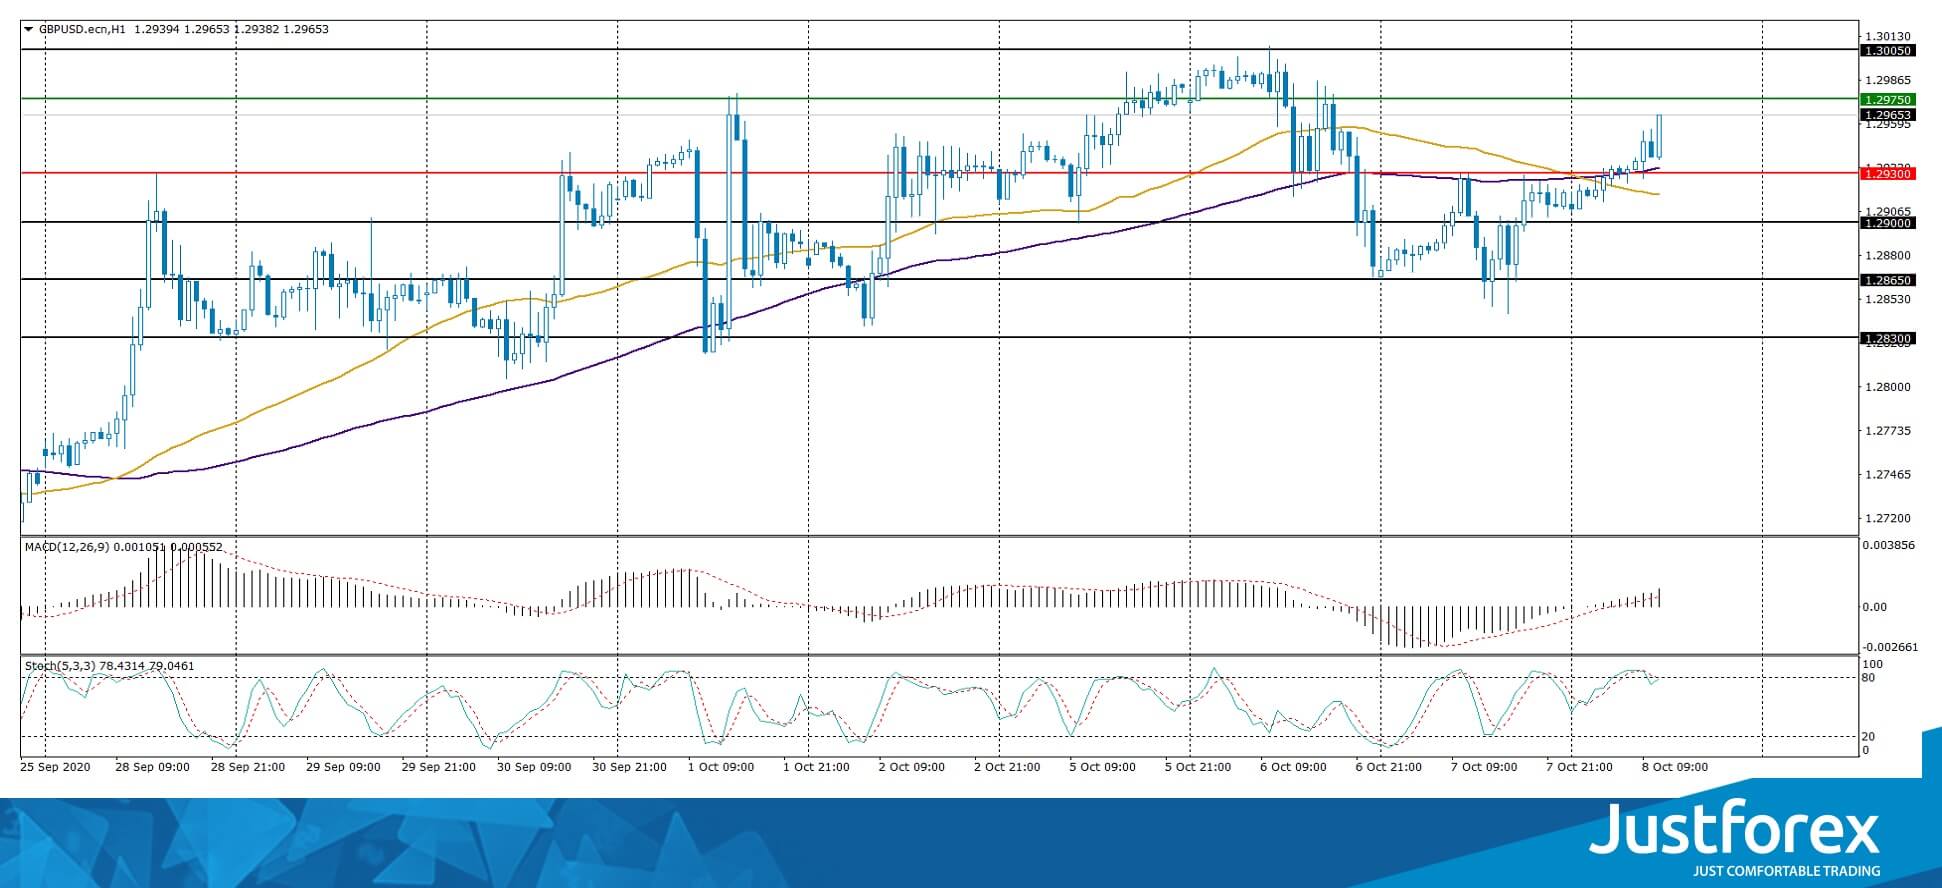
Indicators do not give accurate signals: the price is testing 50 MA and 100 MA.
The MACD histogram has moved into a positive zone, which indicates the bullish sentiment.
Stochastic Oscillator is located near the overbought zone, the %K line has crossed the %D line. There are no signals at the moment.
Trading recommendations
Support levels: 1.2930, 1.2900, 1.2865
Resistance levels: 1.2975, 1.3000, 1.3050
If the price fixes above 1.2975, further growth of the GBP/USD currency pair is expected. The movement is tending to 1.3000-1.3030.
An alternative could be a drop in GBP/USD quotes to 1.2880-1.2850.
The USD/CAD currency pair
Technical indicators of the currency pair:
Prev Open: 1.33047
Open: 1.32596
% chg. over the last day: -0.41
Day’s range: 1.32369 – 1.32657
52 wk range: 1.2949 – 1.4669
USD/CAD quotes continue to show a negative trend. The trading instrument has updated local lows. At the moment, the loonie is consolidating in the range of 1.3235-1.3265. Further strengthening of the Canadian dollar against the greenback is possible. We recommend paying attention to the dynamics of “black gold” prices. Positions should be opened from key levels.
At 15:30 (GMT+3:00), data on building permits in Canada will be published.
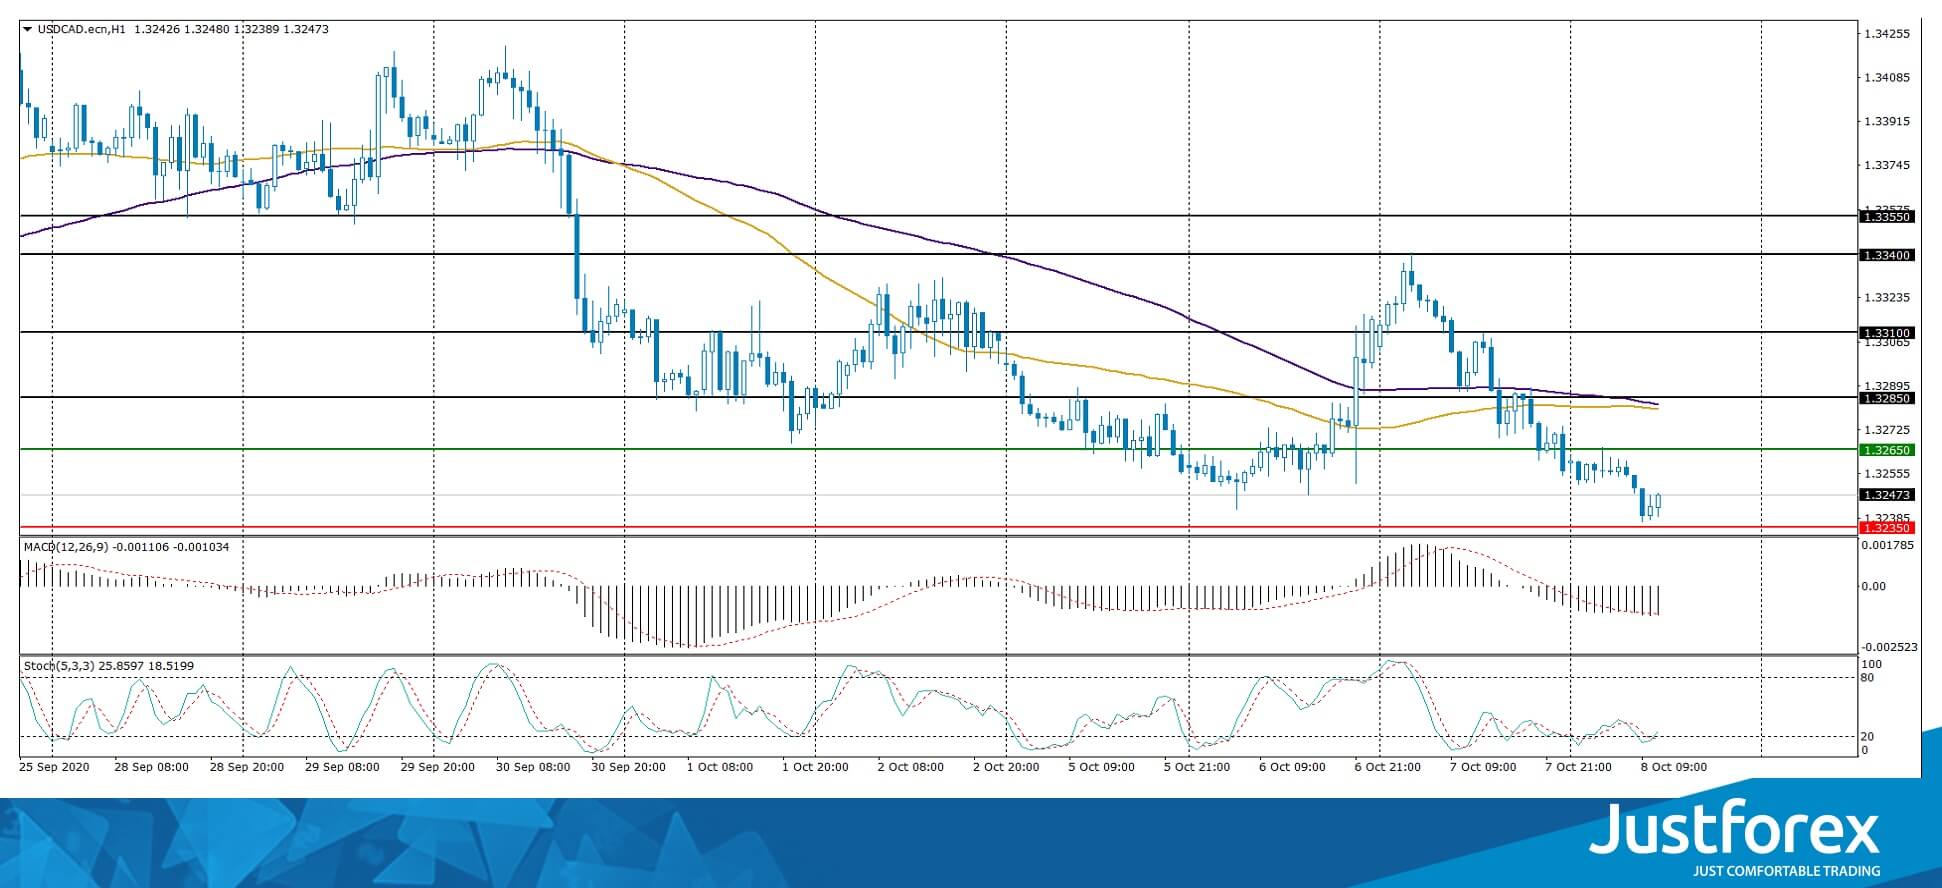
Indicators signal the power of sellers: the price has fixed below 50 MA and 100 MA.
The MACD histogram is in the negative zone, which indicates the bearish sentiment.
Stochastic Oscillator is in the oversold zone, the %K line has crossed the %D line. There are no signals at the moment.
Trading recommendations
Support levels: 1.3235, 1.3200
Resistance levels: 1.3265, 1.3285, 1.3310
If the price fixes below 1.3235, USD/CAD quotes are expected to fall further. The movement is tending to 1.3200-1.3180.
An alternative could be the growth of the USD/CAD currency pair to 1.3290-1.3320.
The USD/JPY currency pair
Technical indicators of the currency pair:
Prev Open: 105.609
Open: 105.967
% chg. over the last day: +0.32
Day’s range: 105.924 – 106.106
52 wk range: 101.19 – 112.41
The USD/JPY currency pair has become stable after prolonged growth. At the moment, the trading instrument is consolidating. Local support and resistance levels are 105.90 and 106.10, respectively. In the near future, a technical correction of USD/JPY quotes is possible. We recommend paying attention to the dynamics of US government bonds yield. Positions should be opened from key levels.
The news feed on Japan’s economy is calm.
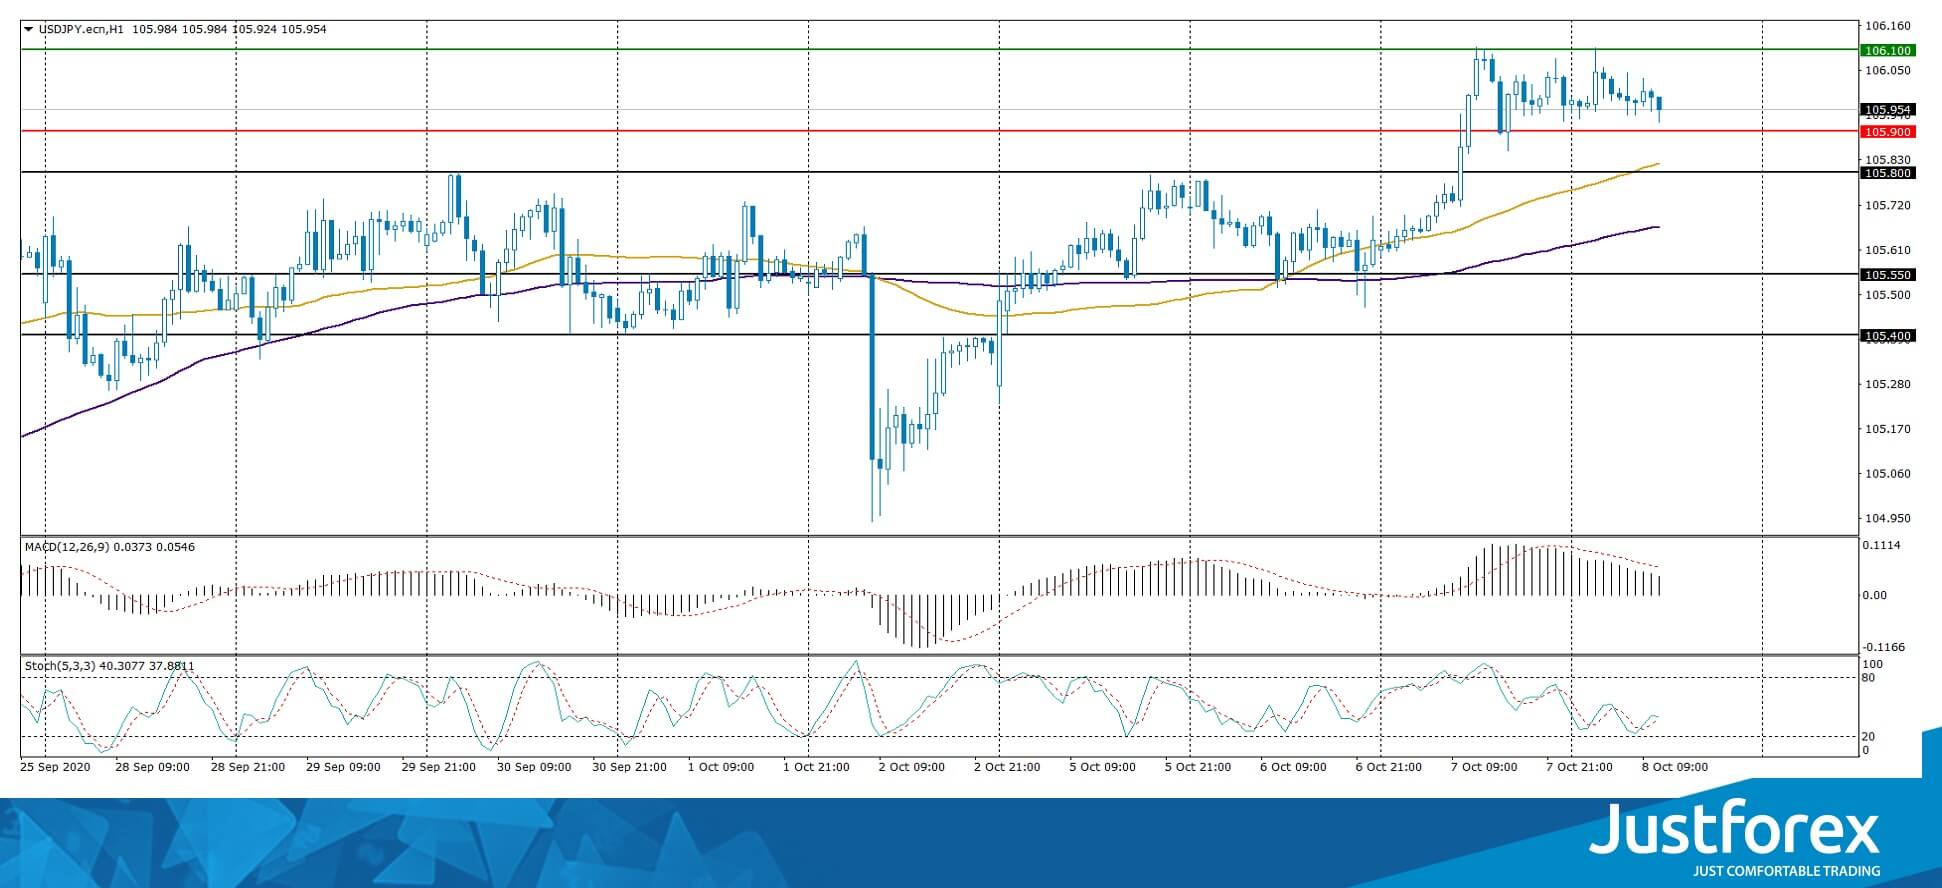
Indicators signal the power of buyers: the price has fixed above 50 MA and 100 MA.
The MACD histogram is in the positive zone, which gives a signal to buy USD/JPY.
Stochastic Oscillator is in the neutral zone, the %K line has started crossing the %D line. There are no signals at the moment.
Trading recommendations
Support levels: 105.90, 105.80, 105.55
Resistance levels: 106.10, 106.50
If the price fixes above 106.10, further growth of USD/JPY quotes is expected. The movement is tending to 106.40-106.60.
An alternative could be a decline in the USD/JPY currency pair to 105.70-105.50.


