Dow Jones Index (DJI 30) showed a strong bullish rebound last week. The rally managed to turn the tables quickly and price action is now testing all-time highs.
This article reviews the wave patterns and expected price path in the upcoming weeks on the daily and 4 hour charts in the aftermath of the U.S. Presidential elections.
Price Charts and Technical Analysis
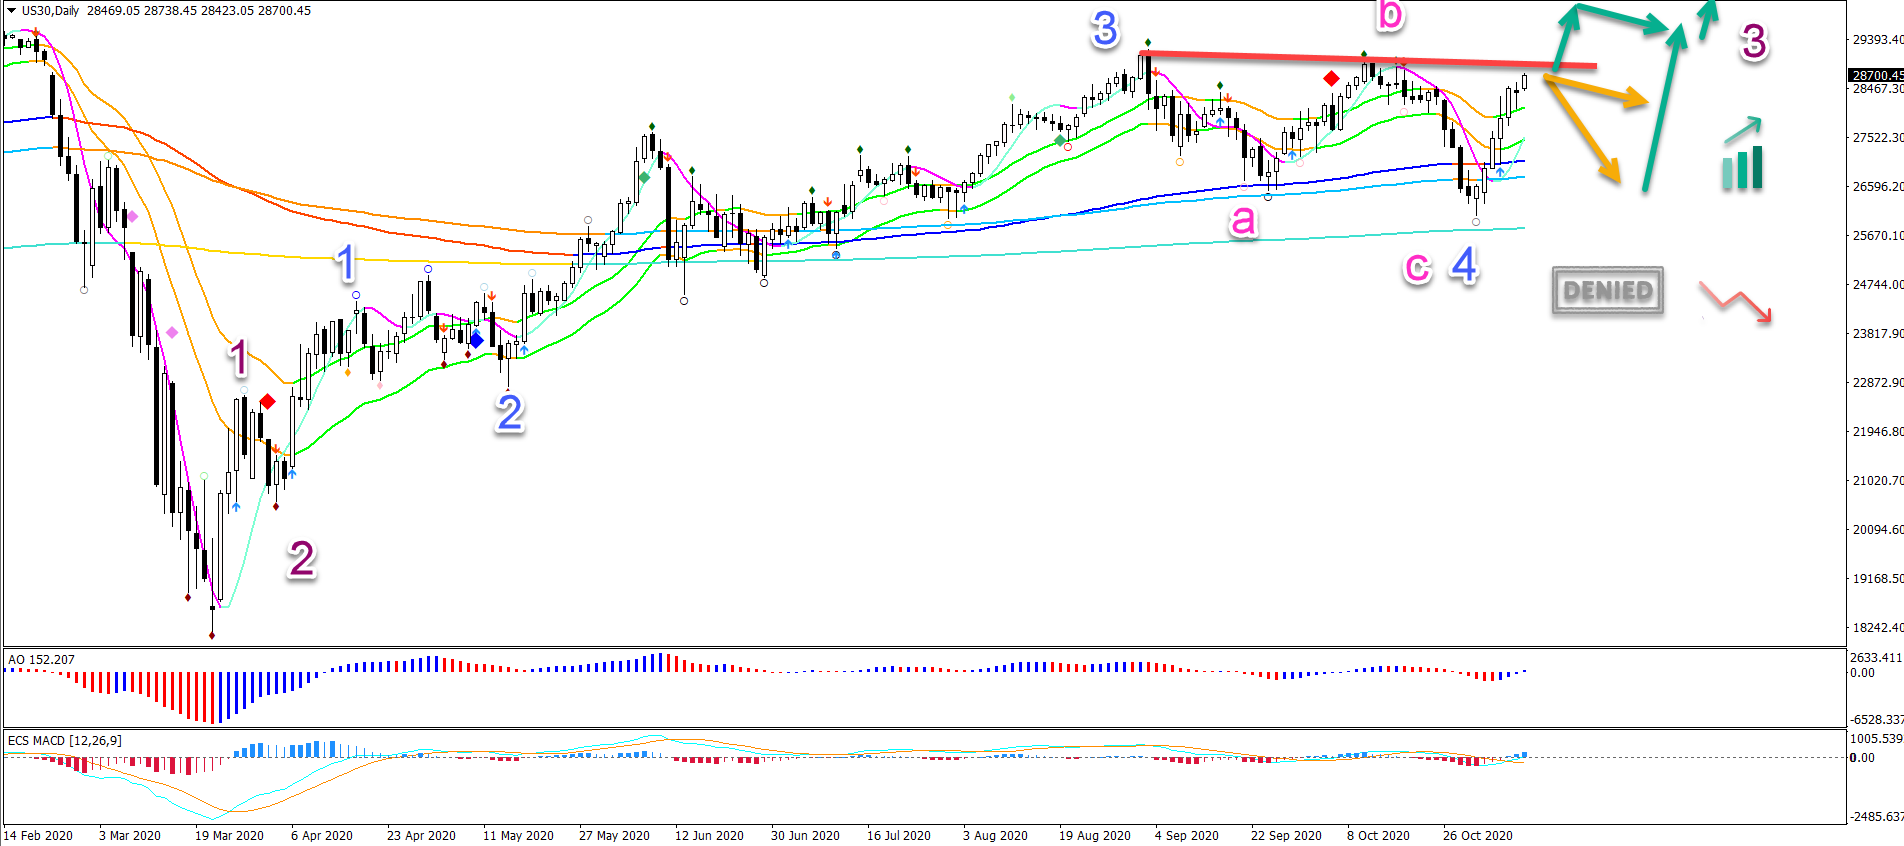
The DJI 30 bullish reversal occurred at the long-term moving averages. The rally indicates that the uptrend is far from over.
In fact, the bearish correction has been marked as an ABC (pink) pattern within wave 4 (blue). If that is true, the uptrend could last for a substantial time. Especially if price action is moving up within wave 3 (purple).
A pullback or rejection (orange arrows) at the resistance is possible. But the uptrend exception remains valid as long as price does not break below the long-term MA (red arrow). Any bullish bounce or breakout could confirm the uptrend.
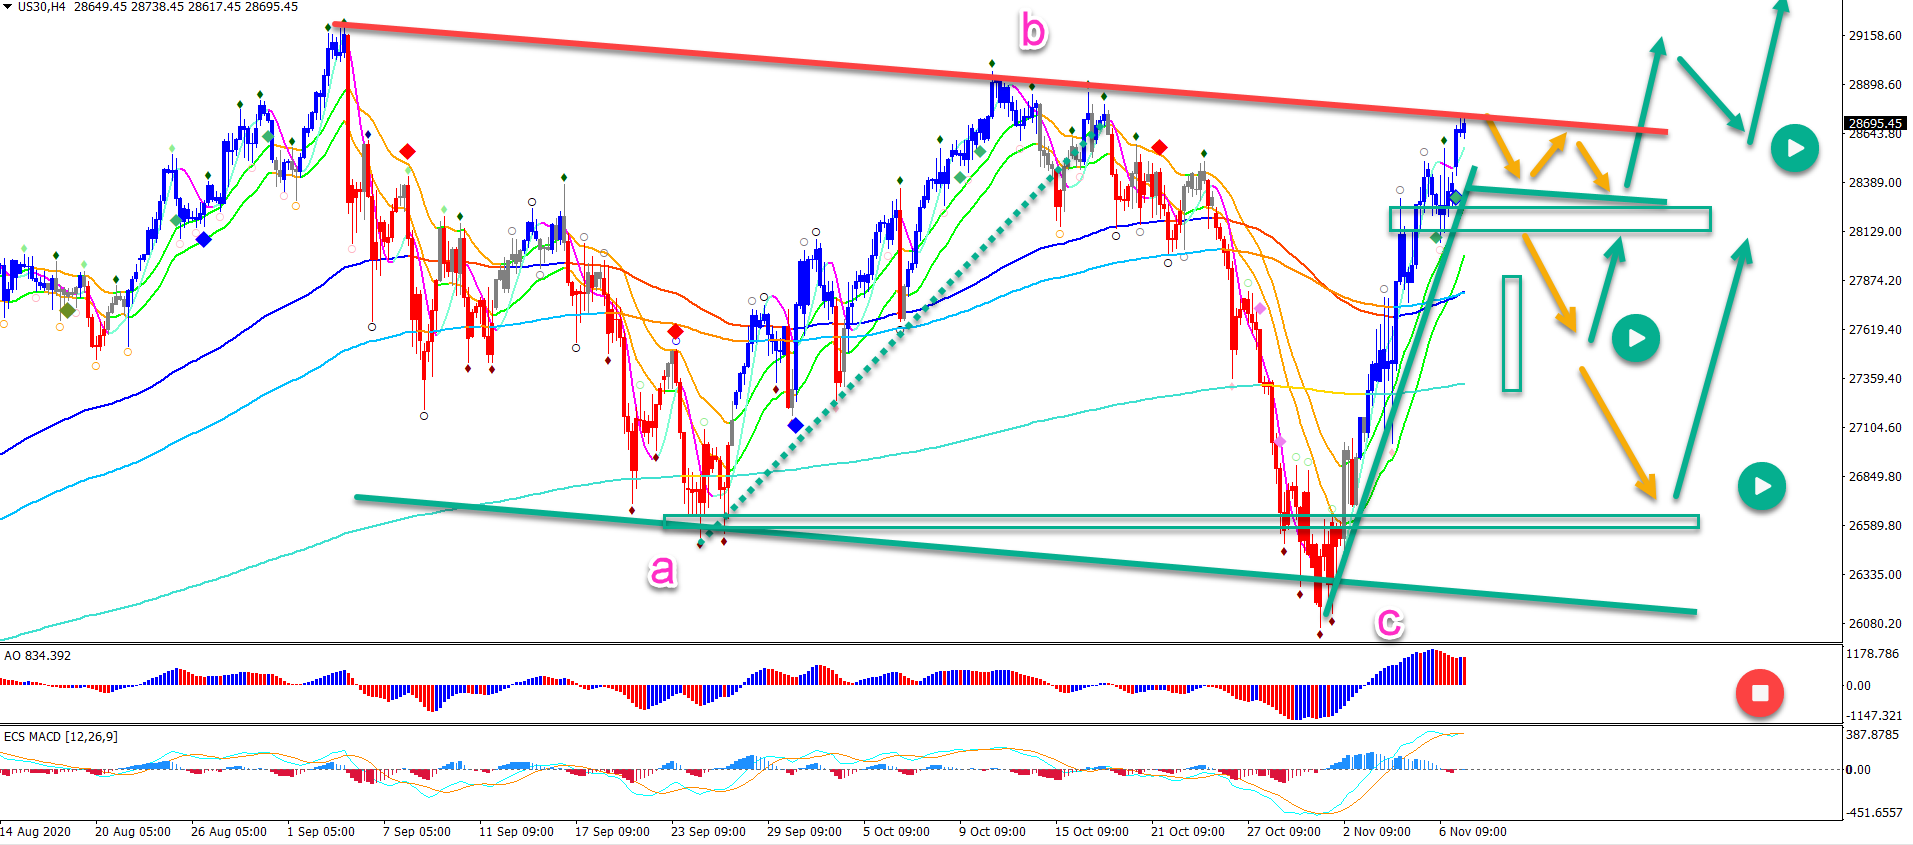
On the 4 hour chart, price action is clearly at a decision zone. This could create either a shallow pullback, deep retracement, or full breakout.
Price action breaking below the bottom invalidates (red circle) the bullish outlook. A bullish breakout is an immediate confirmation of the uptrend. But even a bullish bounce after a retracement or pullback could confirm the uptrend.