
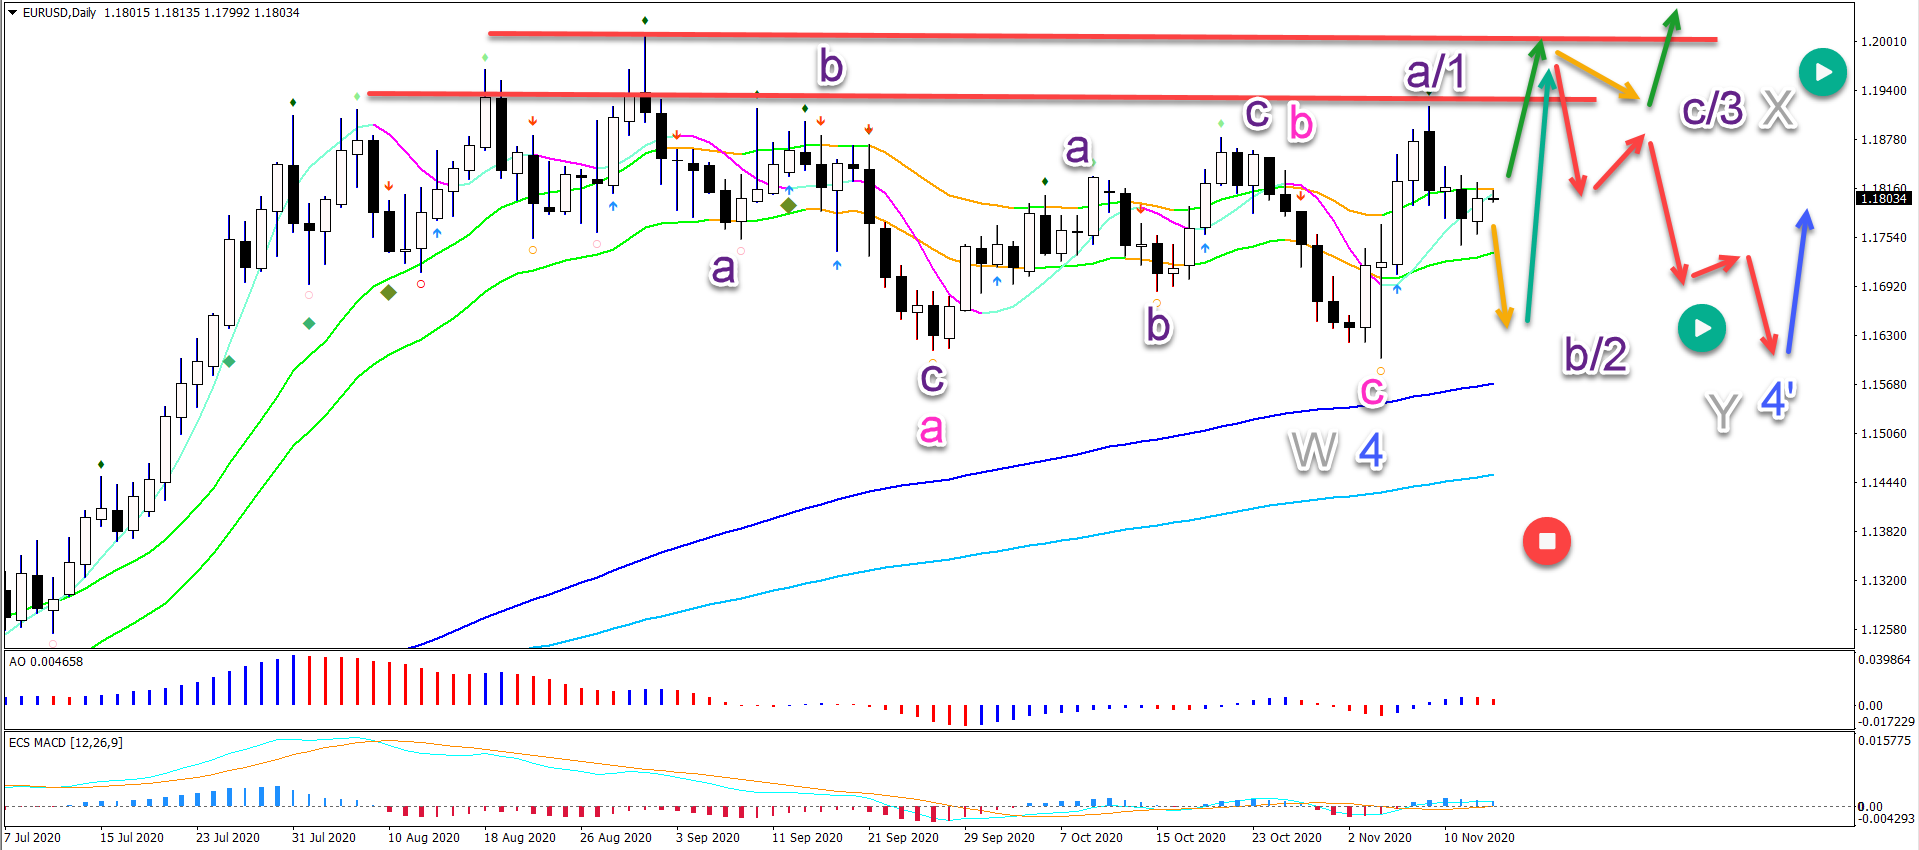
EUR/USD made a bearish bounce after breaking above the 21 ema zone. This is a key decision for either 1 more bearish swing or a bullish bounce.
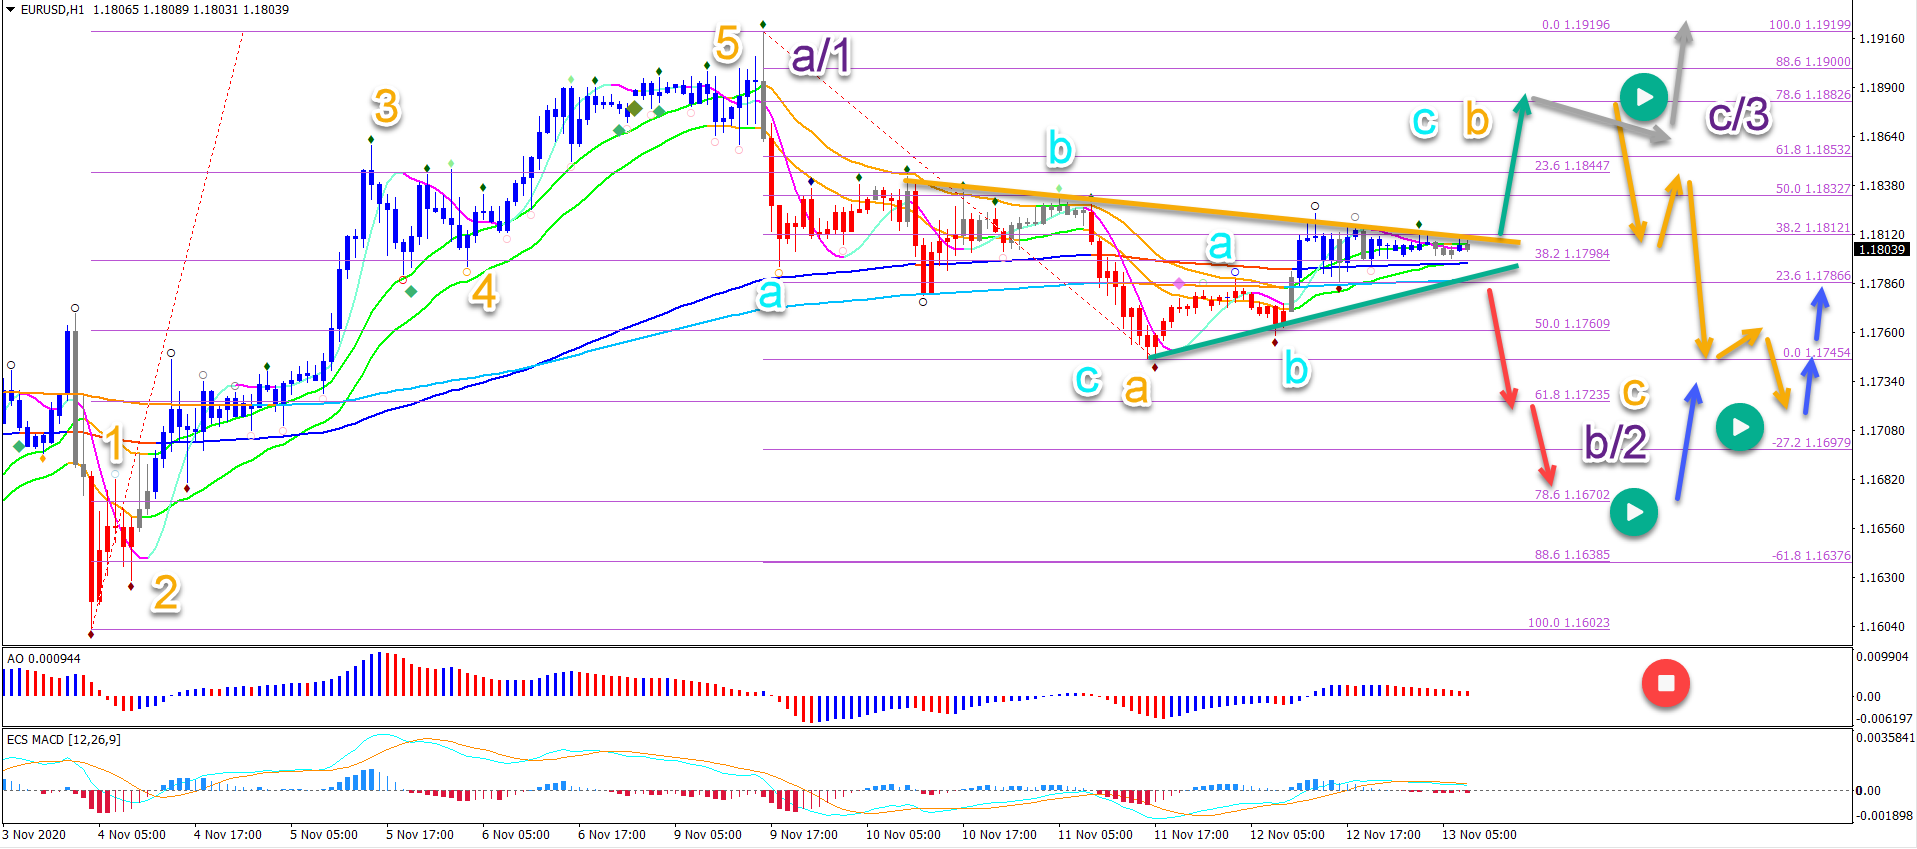
On the 1 hour chart, we see the price action completed a 5 wave pattern (orange). It was followed by an ABC down and an ABC up.
EUR/USD is now moving lower as part of a wave 2 or B. A bearish break indicates a deeper swing where a bullish bounce confirms the end of this swing.
This article reviews the Elliott Wave patterns and the expected price path of least resistance.
Price Charts and Technical Analysis
Eventually a bullish swing is expected to take place (green arrows). This will create either a wave 3 or C. Traders can see whether it’s a wave 3 or C depending on the pattern.
A bull flag (orange arrow) indicates an immediate break within wave 3
A reversal (red arrows) indicates a deeper pullback towards the long-term moving averages within an expanded wave 4’
On the 1 hour chart, we see the price action completed a 5 wave pattern (orange). It was followed by an ABC down and an ABC up.
Now the main levels to watch are the trend lines and 21 ema high and low.
A bearish breakout (red arrows) confirms a deeper wave C (orange) within wave 2 or B (purple)
A bullish breakout offers 2 scenarios:
It can confirm a deeper wave B (orange), which is followed by a 5 wave pattern in wave C (orange)
If a bull flag emerges (grey arrow), then an immediate uptrend can start


