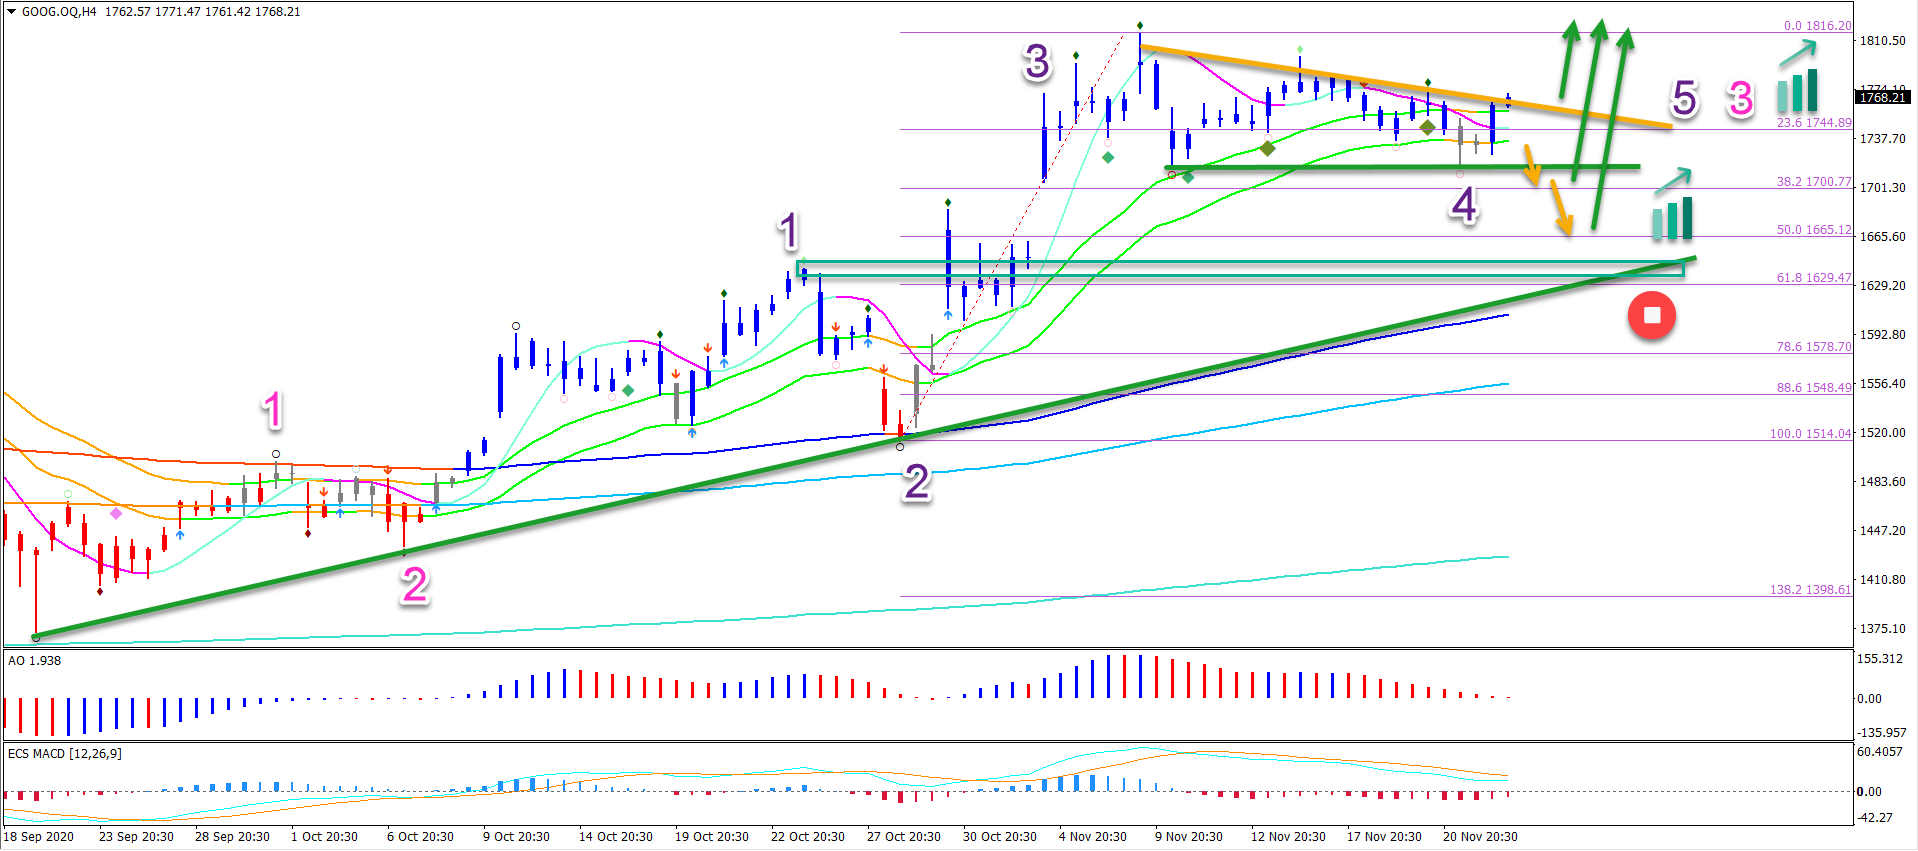
Google made a bullish breakout, pullback, and continuation above the 21 ema zone (blue box). Can the uptrend continue higher?
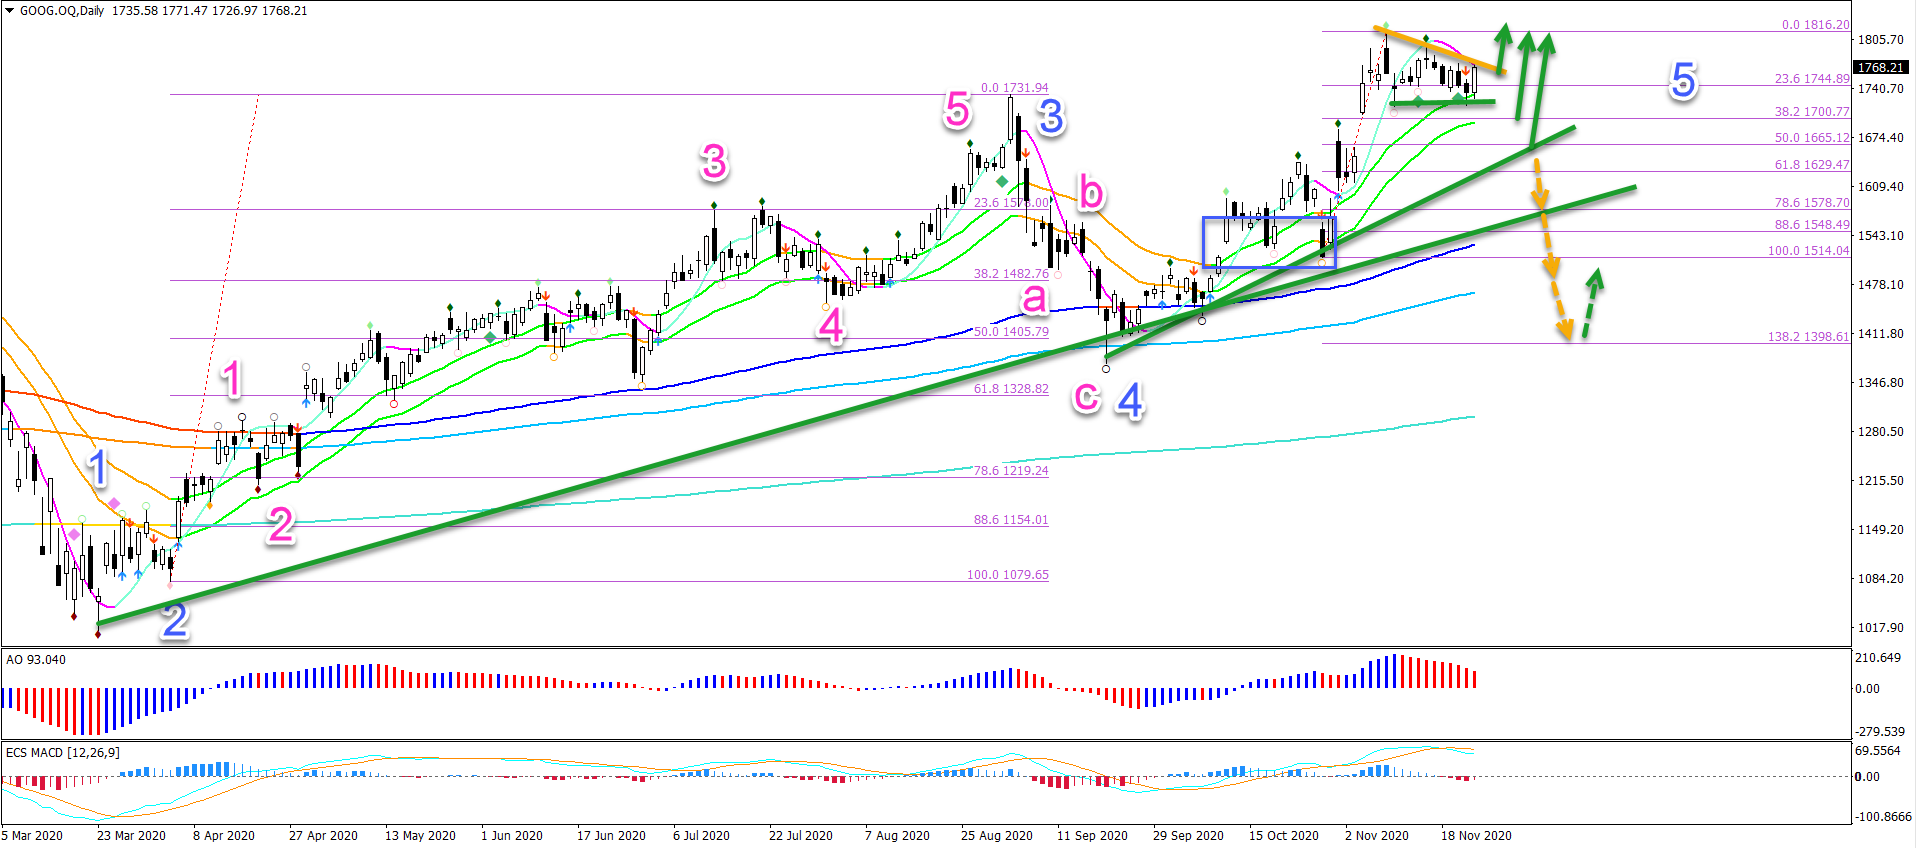
The current bull flag chart pattern suggests that more upside is likely. Even a retracement is likely to find buyers at the 38.2% or 50% Fibonacci levels.
The main target zone of both Fibs is located at the -27.2% Fibonacci target around $1,900 – $1,905.A break above the Fractal at $1800 should confirm it.
Google made a bullish breakout, pullback, and continuation above the 21 ema zone (blue box). Now price action is sailing above the previous top. Can the uptrend continue higher?
Price Charts and Technical Analysis
But price action does not need to retrace. Google could also break the flag and make an immediate bullish swing higher.
On the 4 hour chart, we can see an internal 5 wave pattern (purple) within wave 3 (pink). This indicates that more wave 345 breakout, pullback and continuations are expected.
A break below the 50% Fibonacci and top of wave 1 (green box) does invalidate (red circle) the current wave pattern.