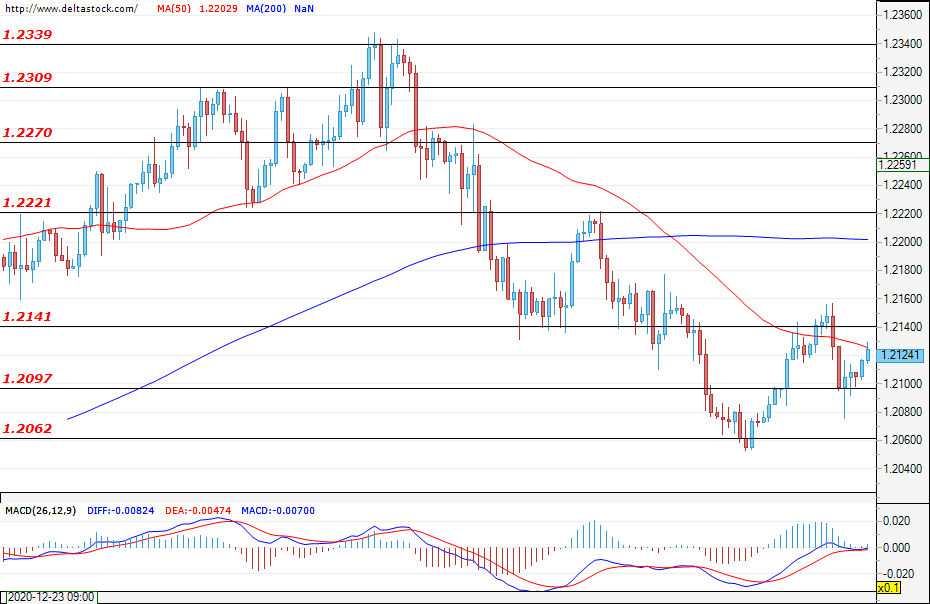
EUR/USD
Current level – 1.2124
The negative decline after the unsuccessful attempt at violating the resistance zone at 1.2141 was limited around the zone at 1.2097. During the early hours of today’s trading, the bulls took control and a new test of the aforementioned zone at 1.2141 could be expected. А successful breach here would strengthen the positive expectations for the future path of the EUR/USD and could easily lead to a test of the next target at 1.2221. If bears re-enter the market, a violation of the support zone at 1.2097 could easily pave the way towards the lows at around 1.2062. Volatility could rise today when the European central bank Interest rate decision (12:45 GMT) and the data on the U.S. initial jobless claims (13:30 GMT) will both be announced.
| Resistance | Support | ||
| intraday | intraweek | intraday | intraweek |
| 1.2141 | 1.2270 | 1.2097 | 1.1950 |
| 1.2221 | 1.2309 | 1.2062 | 1.1915 |
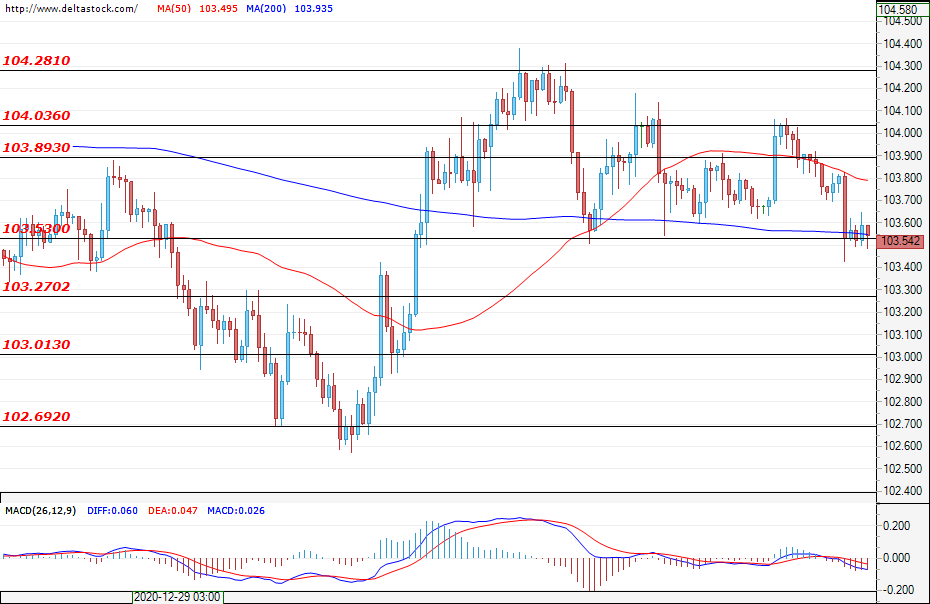
USD/JPY
Current level – 103.54
The USD lost some ground and, at the time of writing this analysis, the price is about to test the important support zone at 103.53. A successful breach for the bears here could deepen the pullback and easily lead to an attempt at violating the next target at 103.27. The first resistance for the bulls lies at the level of 103.89, but only a successful breach of the next target at 104.03 could change the current market sentiments.
| Resistance | Support | ||
| intraday | intraweek | intraday | intraweek |
| 103.89 | 104.28 | 103.53 | 103.01 |
| 104.03 | 104.58 | 103.27 | 102.69 |
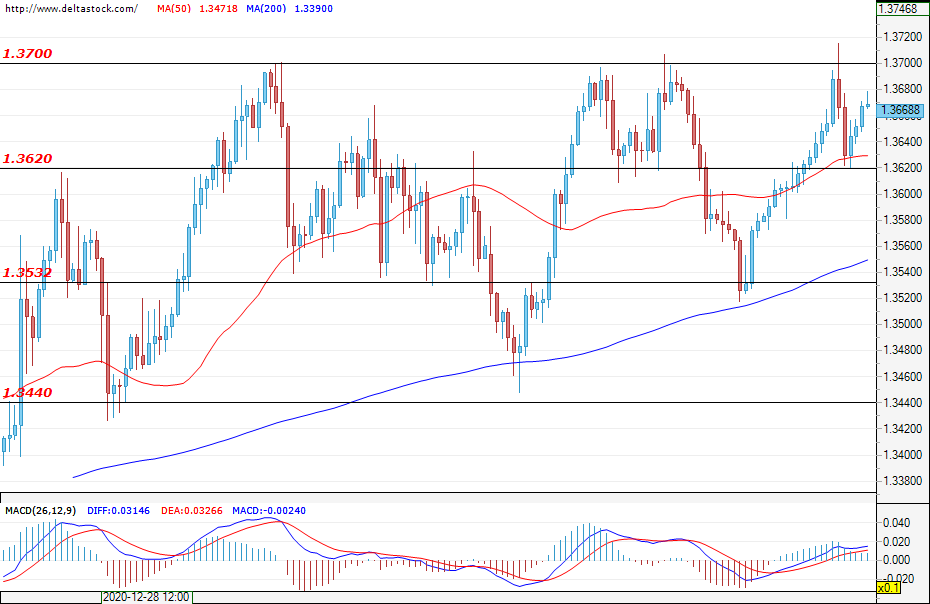
GBP/USD
Current level – 1.3668
The support zone at 1.3620 successfully held the negative correction. The price recovered and easily reached the current level of around 1.3668. The positive sentiments remain intact and a successful test of the resistance zone at 1.3700 is a probable scenario. This could easily lead to a rally and future gains for the GBP against the USD. If sellers manage to retake control, a breach of the support zone at 1.3620 could bring the trading session back into the range between 1.3532 and 1.3620.
| Resistance | Support | ||
| intraday | intraweek | intraday | intraweek |
| 1.3700 | 1.3860 | 1.3620 | 1.3440 |
| 1.3700 | 1.3980 | 1.3532 | 1.3315 |