EUR/USD
The EUR/USD pair closed the week in the red at 1.1759, after rallying for five consecutive ones, but off the low set on Thursday at 1.1661, following the release of ECB’s account of the monetary meeting that took place last July. The document indicated that the ECB is concerned that EUR’s strength could delay the timing on reaching their inflation rate of below, but close to 2%. The news came after an early week headline coming from Reuters, indicating that Mario Draghi won’t discuss monetary policy in the upcoming Jackson Hole meeting, both pouring cold water on hopes for soon-to-come tapering in the EU. Dollar’s gains were limited as the FOMC Minutes, also released this past week, indicated that policymakers are split over what’s next for rates, concerned over soft inflation, but still willing to reduce its balance sheet on "an upcoming meeting."
This upcoming week, the release of preliminary Markit August PMIs for Europe and the US will gather most of the market’s attention, alongside with the Jackson Hole Symposium, where worldwide policymakers will meet to discuss economic policy. Investors will be looking for clues on tightening, particularly coming from Yellen and Draghi.
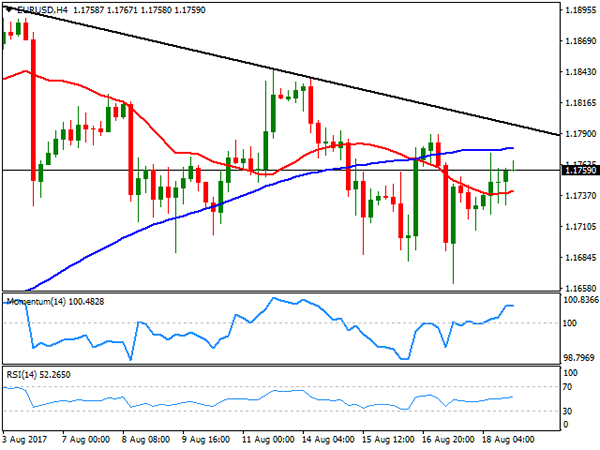
Ever since reaching this year’s high at 1.0900 late July, the pair has been on retreat mode, but given that the pair has barely eased around 150 pips, it’s too early to call for a trend-reversal. The movement remains corrective, mostly due to the absence of dollar’s demand, amid softer inflation which reduced chances of a third rate hike for this year. Nevertheless, the corrective movement can extend during the next few days, as in the daily chart, the price has been unable to recover above a horizontal 20 DMA, while a daily descendant trend line coming from the mentioned high stands now around 1.1800. The Momentum indicator in the mentioned chart is losing its bearish strength, but still heading south within negative territory, while the RSI indicator hovers around 55, with no certain directional strength. Shorter term, and according to the 4 hours chart, the pair presents a neutral stance, with technical indicators flat within positive territory and the price trapped between its 20 and 100 SMAs, both directionless. The 1.1820/30 price zone is the key resistance to overcome to open doors for a new leg higher towards the mentioned yearly high.
Support levels: 1.1715 1.1685 1.1650
Resistance levels: 1.1820 1.1860 1.1910
USD/JPY
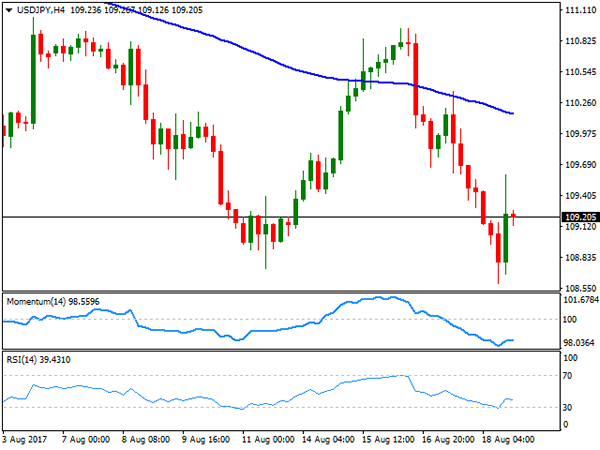
The USD/JPY pair closed the week unchanged in the 109.20 region, as the positive mood from early week that drove the pair up to 110.02 was quickly reversed after the release of the FOMC Minutes, Trump’s advisors woes, and the terror attacks that took place in Europe. Adding to the sour worldwide picture, US political jitters added to yen’s strength these last few days, after President Trump lost several advisors in different events. His soft response to a white nationalist attack during the previous weekend put an end to two economic advisory councils, who criticized him for saying that "both sides" were to blame for the Charlottesville incident. Adding fuel to the fire, Trump’s chief strategist, Stephen Bannon, left the administration on Friday. Treasury yields trimmed their early week gains to end it flat, with the 10-year note benchmark at 2.19%, a multi-week low. Despite Friday’s recovery, the pair maintains its bearish tone, given that in the daily chart, technical indicators resumed their slides after failing to regain positive territory at the beginning of the week, while the price remains well below its 100 and 200 DMAs. Shorter term and according to the 4 hours chart, the pair is well below bearish 100 and 200 SMAs, whilst technical indicators barely corrected oversold conditions before losing their upward strength, also supporting additional declines ahead.
Support levels: 108.80 108.40 107.90
Resistance levels: 109.60 110.00 110.35
GBP/USD
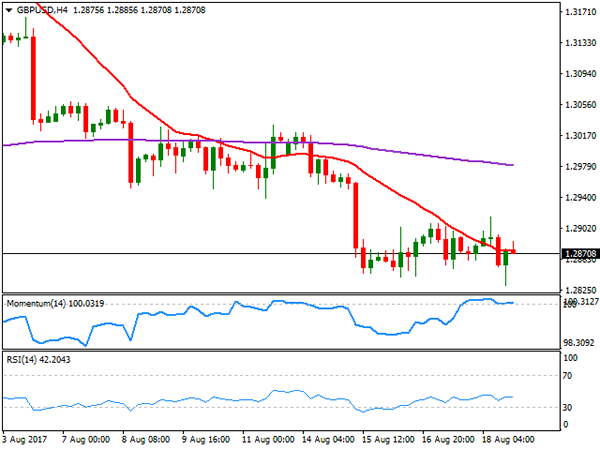
The GBP/USD pair fell for a third consecutive week to settle at 1.2870 on Friday, although the bearish pressure somehow eased over the last few days, mostly due to self-dollar’s weakness. The Pound has been unable to attract buyers ever since BOE’s chances of a rate hike fell alongside with inflation expectations. Despite being well above the central bank’s 2% target, inflation has been below expected for two consecutive months, taking off the pressure over policymakers. Still, uncertainty surrounding the economic future of the kingdom after the Brexit, undermines demand for Sterling. The pair has been consolidating for three consecutive days, and Friday ended up with a doji, indicating that the BOE’s on-hold stance has been fully priced-in, and that the market will now wait for fresher clues to decide what’s next. Nevertheless, technical readings keep suggesting further slides ahead as the price settled well below a bearish 20 DMA, whilst technical indicators maintain their bearish slopes, nearing oversold levels. In the 4 hours chart, the technical picture is neutral-to-bearish with the pair stuck around a bearish 20 SMA, the Momentum indicator heading nowhere around its 100 level, and the RSI indicator heading modestly south around 42. The pair bottomed for the week at 1.2831, the immediate short-term support for this Monday.
Support levels: 1.2830 1.2795 1.2760
Resistance levels: 1.2895 1.2930 1.2965
GOLD
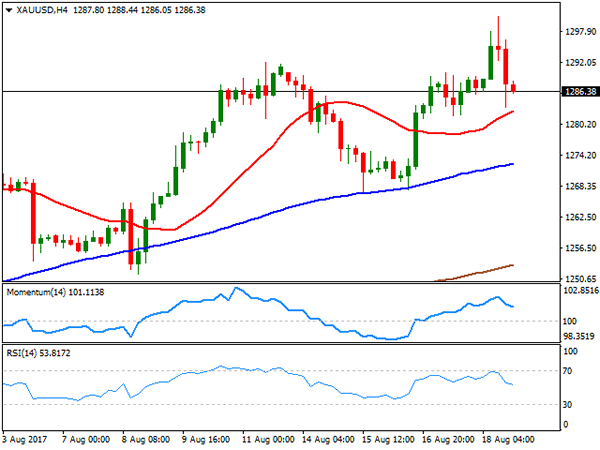
Gold prices changed course on Friday, with spot ending the week marginally lower at $1,286.38 a troy ounce after reaching a fresh 2017 high of 1,300.72. The commodity got market’s favor during the second half of the past week, amid a dovish tone coming from US policy makers in the form of the FOMC Minutes, and the terror attack that took place in Spain. On Friday, however, equities pared their sell-off, whilst the inability of the commodity to rally pass the psychological threshold of 1,3000 fueled profit taking at the end of the day. From a technical point of view, the daily chart shows that the price remains well above all of its moving averages, with the 20 DMA maintaining a sharp bullish slope far below the current level, while technical indicators remain within positive territory, but losing upward strength and posting lower highs, drawing a bearish divergence that is yet to be confirmed. In the 4 hours chart, the technical picture is quite alike with the price holding above all of its moving averages, whilst technical indicators retreat from overbought levels, with strong bearish slopes, but still above their mid-lines.
Support levels: 1,281.65 1,273.95 1,261.20
Resistance levels: 1,292.10 1,300.90 1,309.25
WTI CRUDE OIL
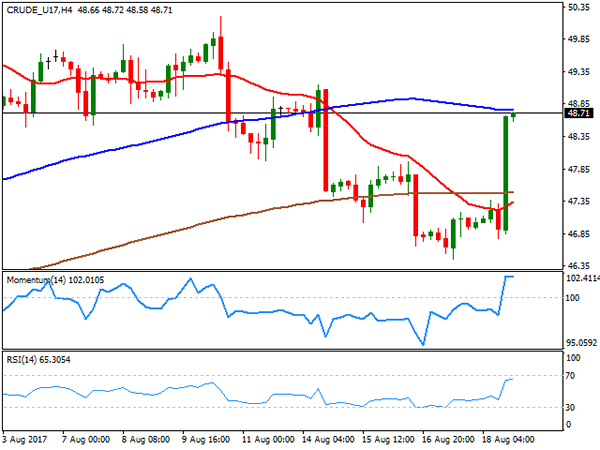
Crude oil prices posted a nice comeback on Friday, with WTI ending the week at $48.71 a barrel, trimming all of its weekly losses amid a string of positive news for the oil market. Following the EIA weekly report that showed a sharp draw-down in US stockpiles, news on Friday revealed that the number of active oil rigs drilling for oil fell by five last week, bringing the total count down to 763, according to Baker Hughes. A broadly weak dollar, also helped WTI that bottomed for the week at 46.45. From a technical point of view, the daily chart shows that the US benchmark settled above its 100 DMA, but below the 20 and 200 DMAs, with the largest having capped July’s advance. Technical indicators in the mentioned chart have recovered ground, but the Momentum remains below its 100 level while the RSI aims north around 54, not enough to confirm additional gains ahead at this point. In the 4 hours chart, the commodity closed right below its 100 SMA, the immediate resistance at 48.90, while technical indicators stabilized well above their mid-lines, losing upward strength at the end of the week amid diminishing volumes.
Support levels: 48.15 47.55 46.85
Resistance levels: 48.90 49.60 50.20
DJIA
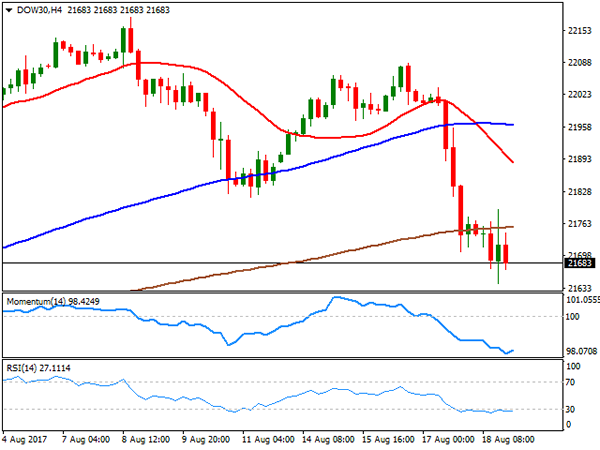
Wall Street closed in the red on Friday, with the Dow and the S&P down for a second consecutive week and the Nasdaq Composite logging its fourth consecutive weekly decline. The Dow Jones Industrial Average lost 76 points, to end at 21.674.51, while the S&P shed 4 points, and ended at 2,425.55. The Nasdaq Composite lost 0.09%, to 6,216.53. Risk aversion led the way lower, amid the terror attack in Spain, alongside with woes in the White House, after several Trump’s advisors left the administration this last week. Investors, however, hesitated on how to price-in the latest US political headline, indicating that Trump’s strategist Stephen Bannon departed the White House. Bannon a well-known nationalist, could have been dismissed in an effort to tame warring factions, but it’s still another advisor quitting, signaling that internal woes keep interfering with the political agenda. Most members were down within the Dow, with Nike being the worst performer, down 4.37% followed by Cisco System that lost 2.16% Caterpillar was the best performer, adding 0.69%, followed by Chevron and Exxon Mobile, which added around 0.50% each on oil’s recovery. Dow’s decline is poised to extend according to technical readings in the daily chart, as indicators keep heading south at multi-month lows, whilst the index extended further below its 20 DMA. In the 4 hours chart, technical indicators stabilized within oversold territory, whilst the index stands below all of its moving averages, 200 SMA contained advances by the end of the week, currently acting as dynamic resistance at 21,757.
Support levels: 21,642 21,603 21,566
Resistance levels: 21,710 21,757 21,790
FTSE100
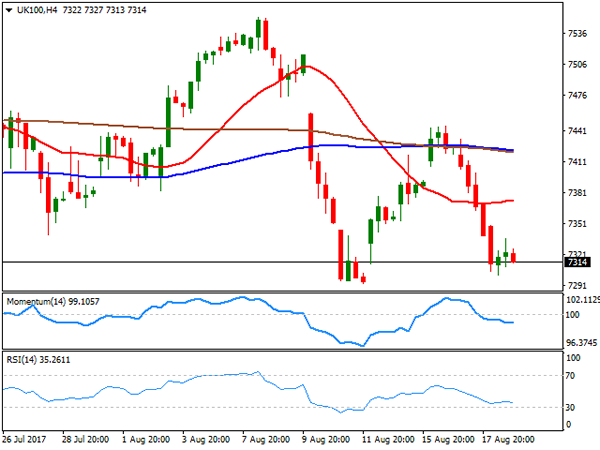
The FTSE 100 fell 63 points or 0.86% on Friday to end the week at 7,323.98, undermined by declines in airlines and travel companies-related equities, following the terror attack in Barcelona from late Thursday. A persistently weak Pound, also hit the Footsie, with only eight members managing to close the day with gains. Randgold Resources was the best performer, up 1.22%, amid a rally in gold prices. Paddy Power Betfair, on the other hand, was the worst performer, ending the day 3.95% lower, followed by Babcock International Group that lost 2.98%. The daily chart shows that the index settled not far above a weekly low of 7,293, also that it failed mid-week to advance beyond a bearish 20 DMA, whilst technical indicators head south within negative territory, all of which maintains the risk towards the downside for the upcoming days. In the shorter term, and according to the 4 hours chart, technical readings also favor a bearish continuation, as the index stands far below all of its moving averages, whilst technical indicators stand well below their mid-lines, although with limited directional strength.
Support levels: 7,293 7,257 7,218
Resistance levels: 7,337 7,369 7,401
DAX
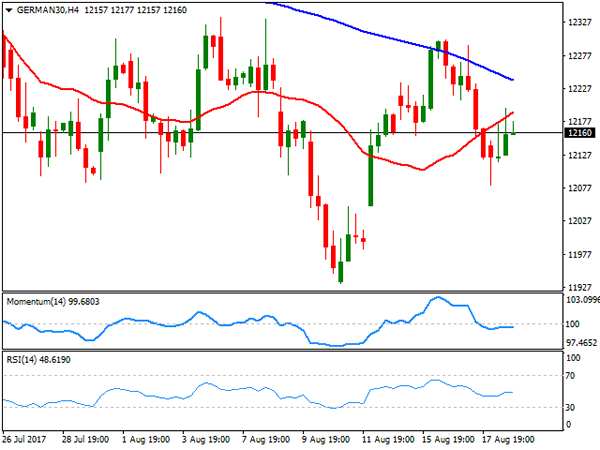
European equities ended in the red, dragged lower by travel-related stocks that plunged after the Barcelona attack, with investors confidence also dented by Trump´s administration woes. The German DAX lost 38 points to end at 12,165.19, with Merck leading decliners, down 1.54%, followed by Fresenius that shed 1.25%. Muenchener was the best performer, adding 1.55%, followed by Commerzbank that gained 1.24%. The daily chart for the benchmark shows that it settled right below a bearish 20 SMA, but also that technical indicators have lost their bearish strength, aiming higher around their mid-lines. Shorter term, however, the risk remains towards the downside, as in the 4 hours chart, the index remains below all of its moving averages, with the 100 and 200 SMAs gaining bearish momentum, whilst technical indicators head nowhere right below their mid-lines. The index bottomed at 12,081 early Friday, with a break below it exposing the 12,000 threshold for early next week.
Support levels: 12,127 12,081 12,034
Resistance levels: 12,126 12,263 12,310