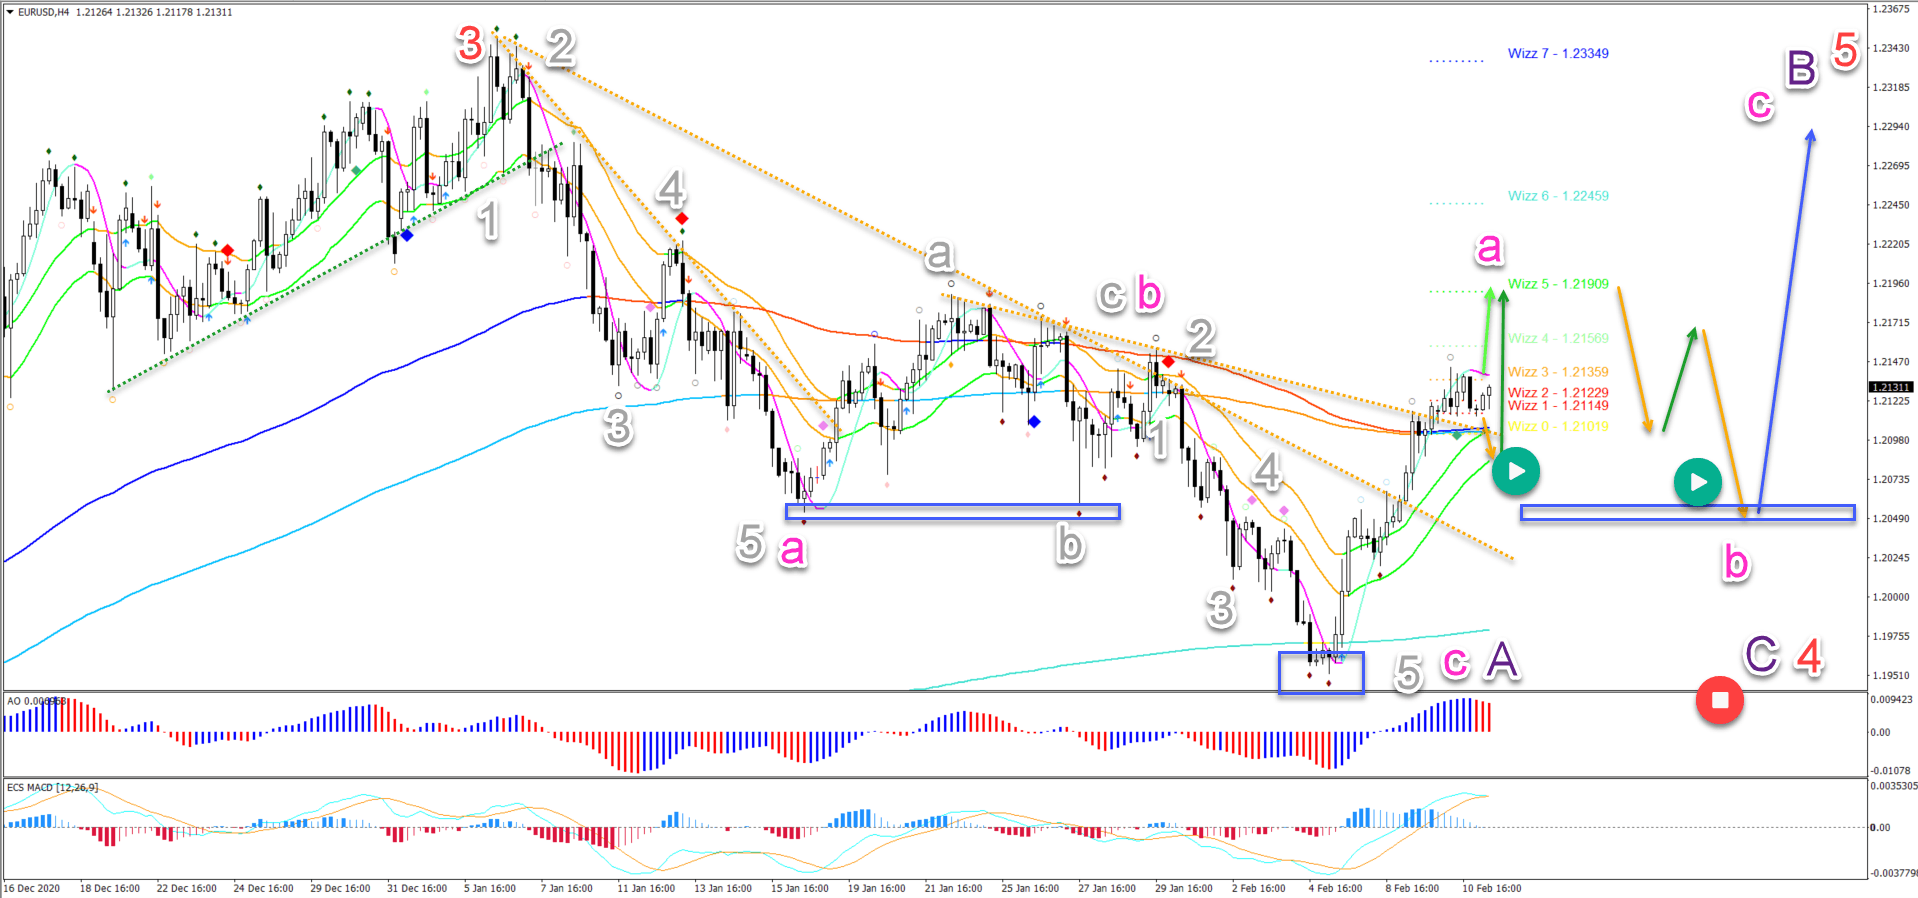
The main target is the Wizz 5 level around 1.2190-1.22. Although price action could extend to Wizz 6 at 1.2250, it seems much less likely to occur.
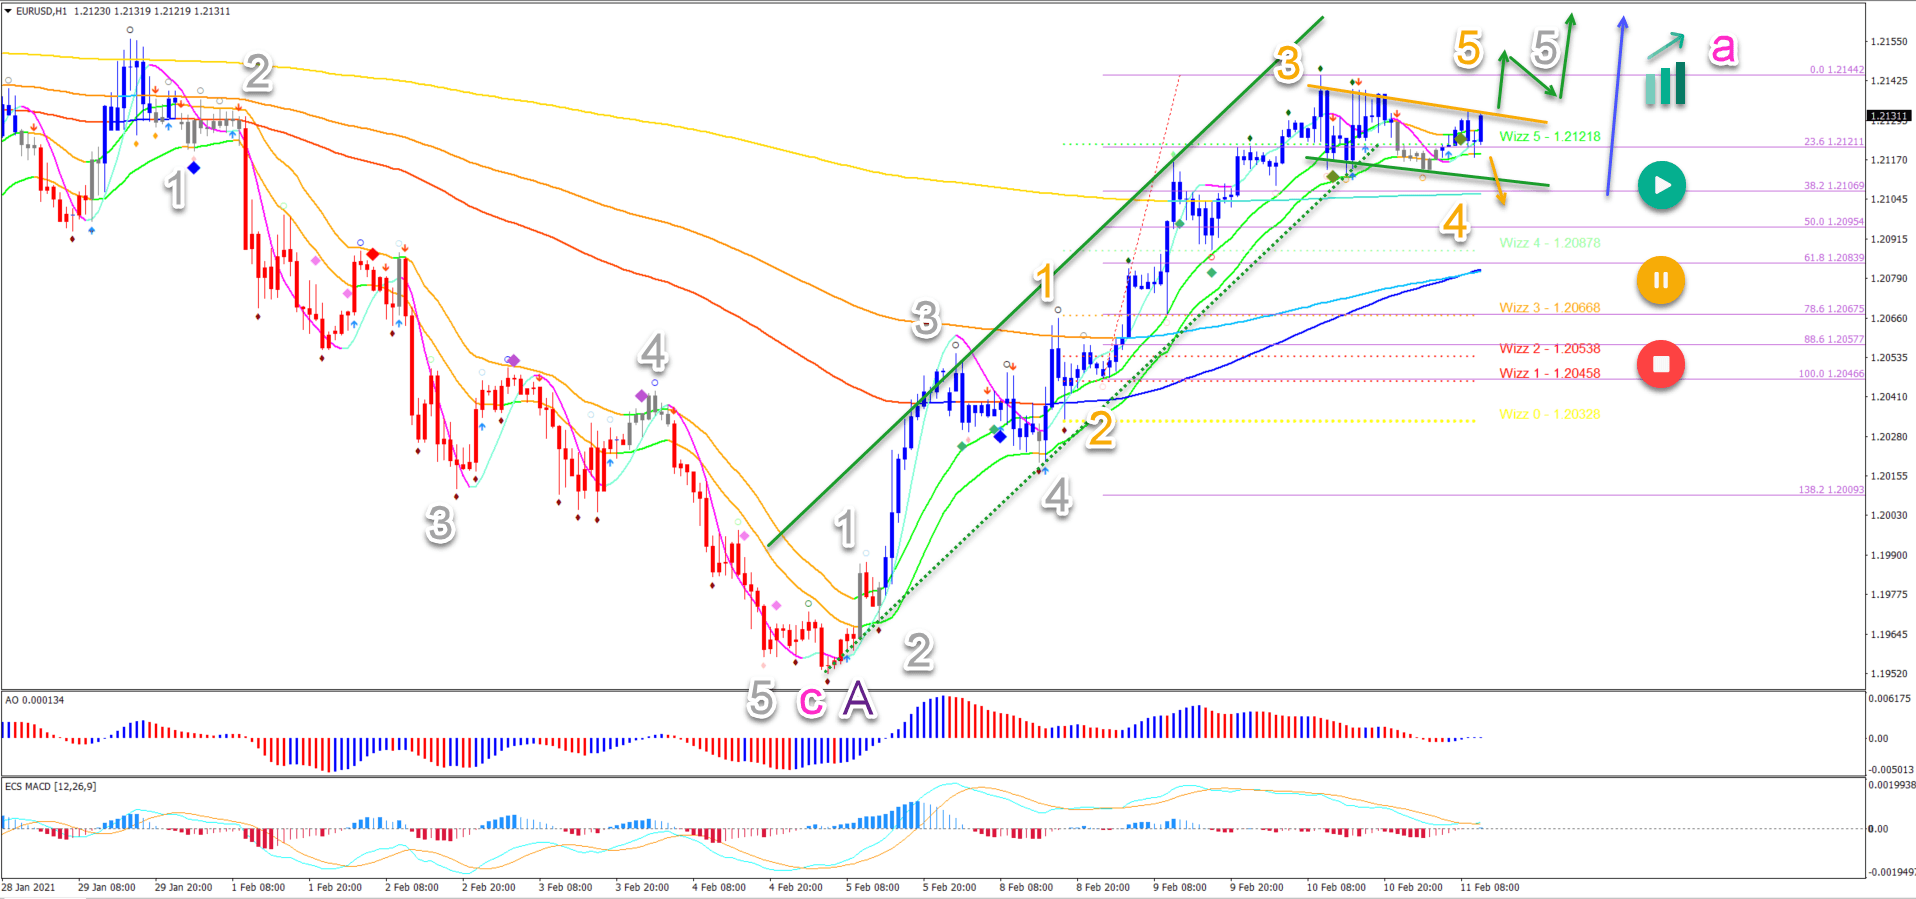
On the 1 hour chart, price action is building an impressive 5th wave (grey). The wave 3 (orange) seems completed at the recent high.
A break above the bull flag chart pattern confirms the push up (green arrows). A push lower (orange arrow) should see a bounce at the 38.2% Fib zone (blue arrow)
The EUR/USD is showing strong bullish momentum (as mentioned in our video). It’s ready for one more push up. However, price is expected to make a bearish bounce eventually.
This article reviews the main targets for the uptrend. And we also analyse the Elliott Wave patterns to understand the upcoming price swings.
Price Charts and Technical Analysis
The impulsive price swing managed to a) bounce at the long-term MA, b) break above the 21 ema, and then c) sail above the resistance trend lines (dotted orange) and 144 ema zone.
With price action above the moving averages, the impulse seems strong enough now to push higher once more:
- Either immediately (light green arrow) or
- After a pullback (orange arrow) to the 21 ema zone (green arrow).
The main target is the Wizz 5 level around 1.2190-1.22. Although price action could extend to Wizz 6 at 1.2250, it seems much less likely to occur.
At the main target, price action is expected to show a bearish ABC pattern (orange arrows). The main target of the bearish bounce is the support zone (blue box) because of the inverted head and shoulders pattern (blue boxes). That is where we expect the uptrend to resume (blue arrow).
On the 1 hour chart, price action is building an impressive 5th wave (grey):
- The wave 3 (orange) seems completed at the recent high.
- The current pullback is shallow and choppy, just as we expect from a wave 4 (orange).
- The wave 4 remains valid if price is above the 38.2-50% Fib.
- A break below the 61.8% Fib places the uptrend in hold or invalidates it (yellow/red circles).
A break above the bull flag chart pattern confirms the push up (green arrows). A push lower (orange arrow) should see a bounce at the 38.2% Fib zone (blue arrow) – if the bullish wave 5 of 5 holds.