GBP/USD bearish retracement was expected. But the impulsiveness of the decline is very strong, which is 1 of the main reasons for the potential end of the uptrend
A strong bullish bounce could create a bullish ABC up (blue arrows). Whereas a bear flag (grey arrows) should send the GU pair lower again in a wave 345
GBP/USD bullish bounce will be a key factor in determining the next price swings. The bearish pullback after the heavy uptrend was expected.
The GBP/USD made a bearish reversal as expected in our video analysis. The main question is whether the uptrend is over or is it just a retracement?
This article analyses what future price patterns are critical for answering this key question.
Price charts and technical analysis
The GBP/USD bearish retracement was expected. But the impulsiveness of the decline is very strong, which is 1 of the main reasons for the potential end of the uptrend.
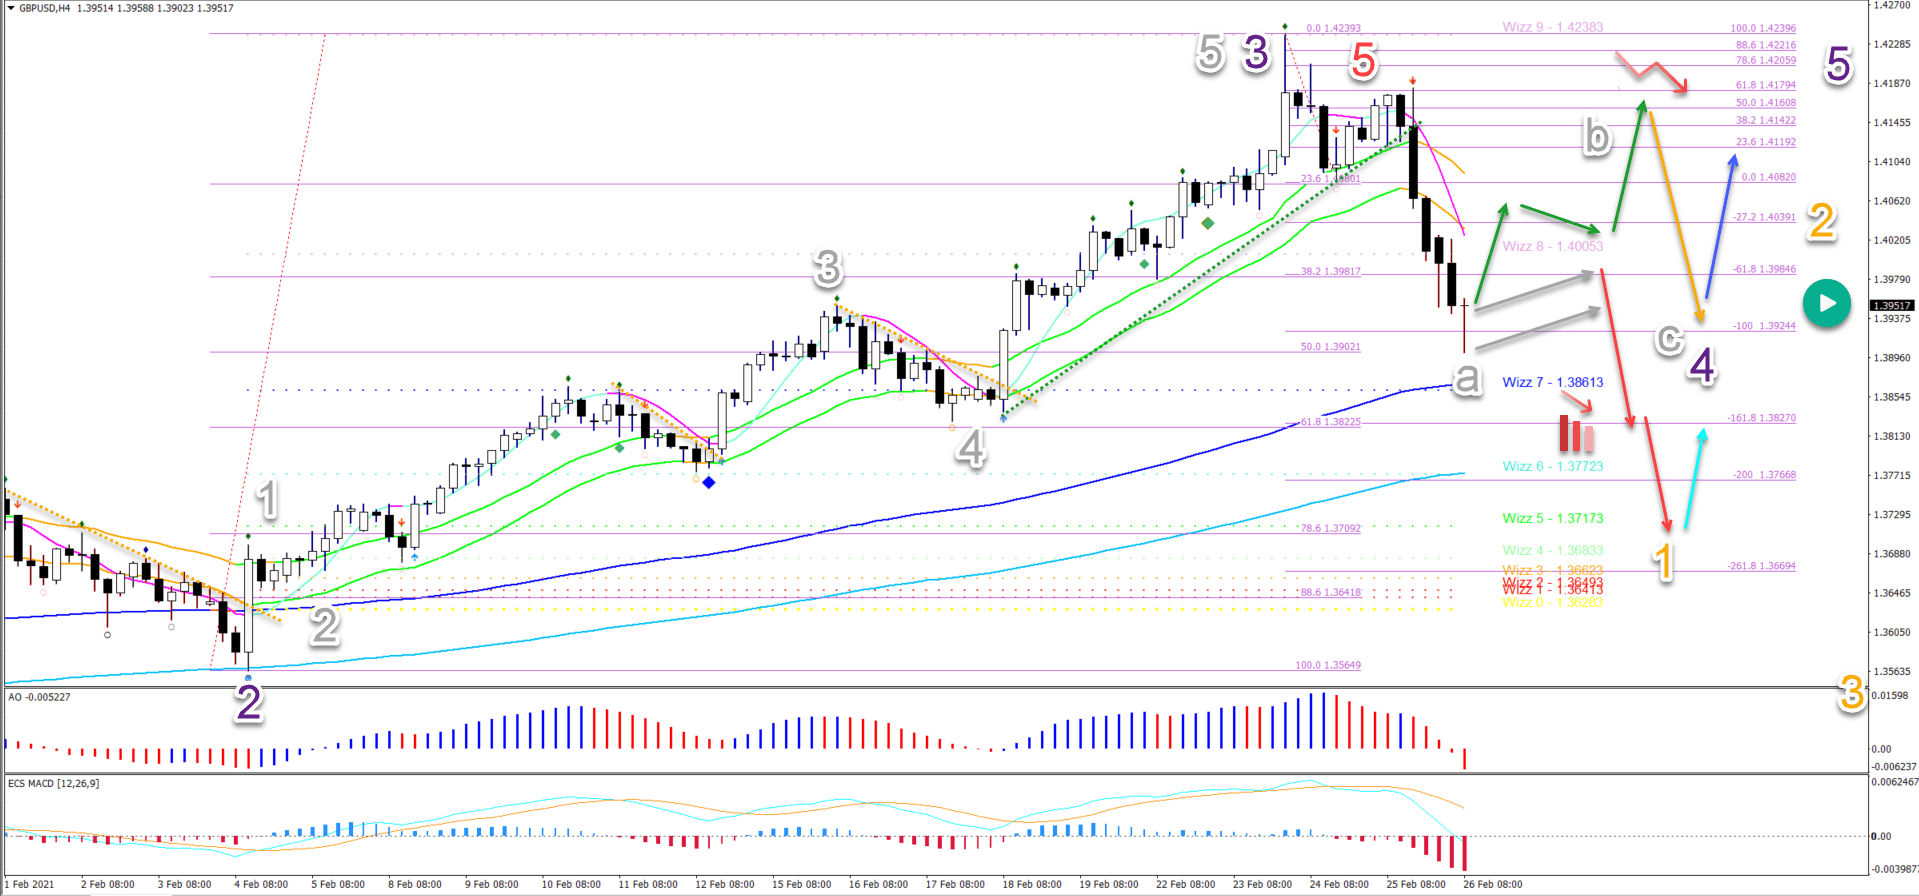
The main pattern to keep an eye on now is the potential bounce at the support zone. This includes the Fibonacci targets, retracements, and 144 ema close.
A strong bullish bounce (green arrows) makes it more likely that the current decline is part of a wave A (grey) of a larger wave 4 (purple) correction.
In that case, a bearish bounce at the previous highs is expected and a larger consolidation zone should appear.
A weak bullish bounce (grey arrows) indicates lack of buyers and a bearish continuation pattern.
In that case, a bearish breakout (red arrows) should take the price lower.
This could confirm a wave 1 (orange) of a new downtrend.
The GBP/USD bullish bounce will be a key factor in determining the next price swings. The bearish pullback after the heavy uptrend was expected. Now it’s a key moment to see whether the price patterns indicate a larger correction down.
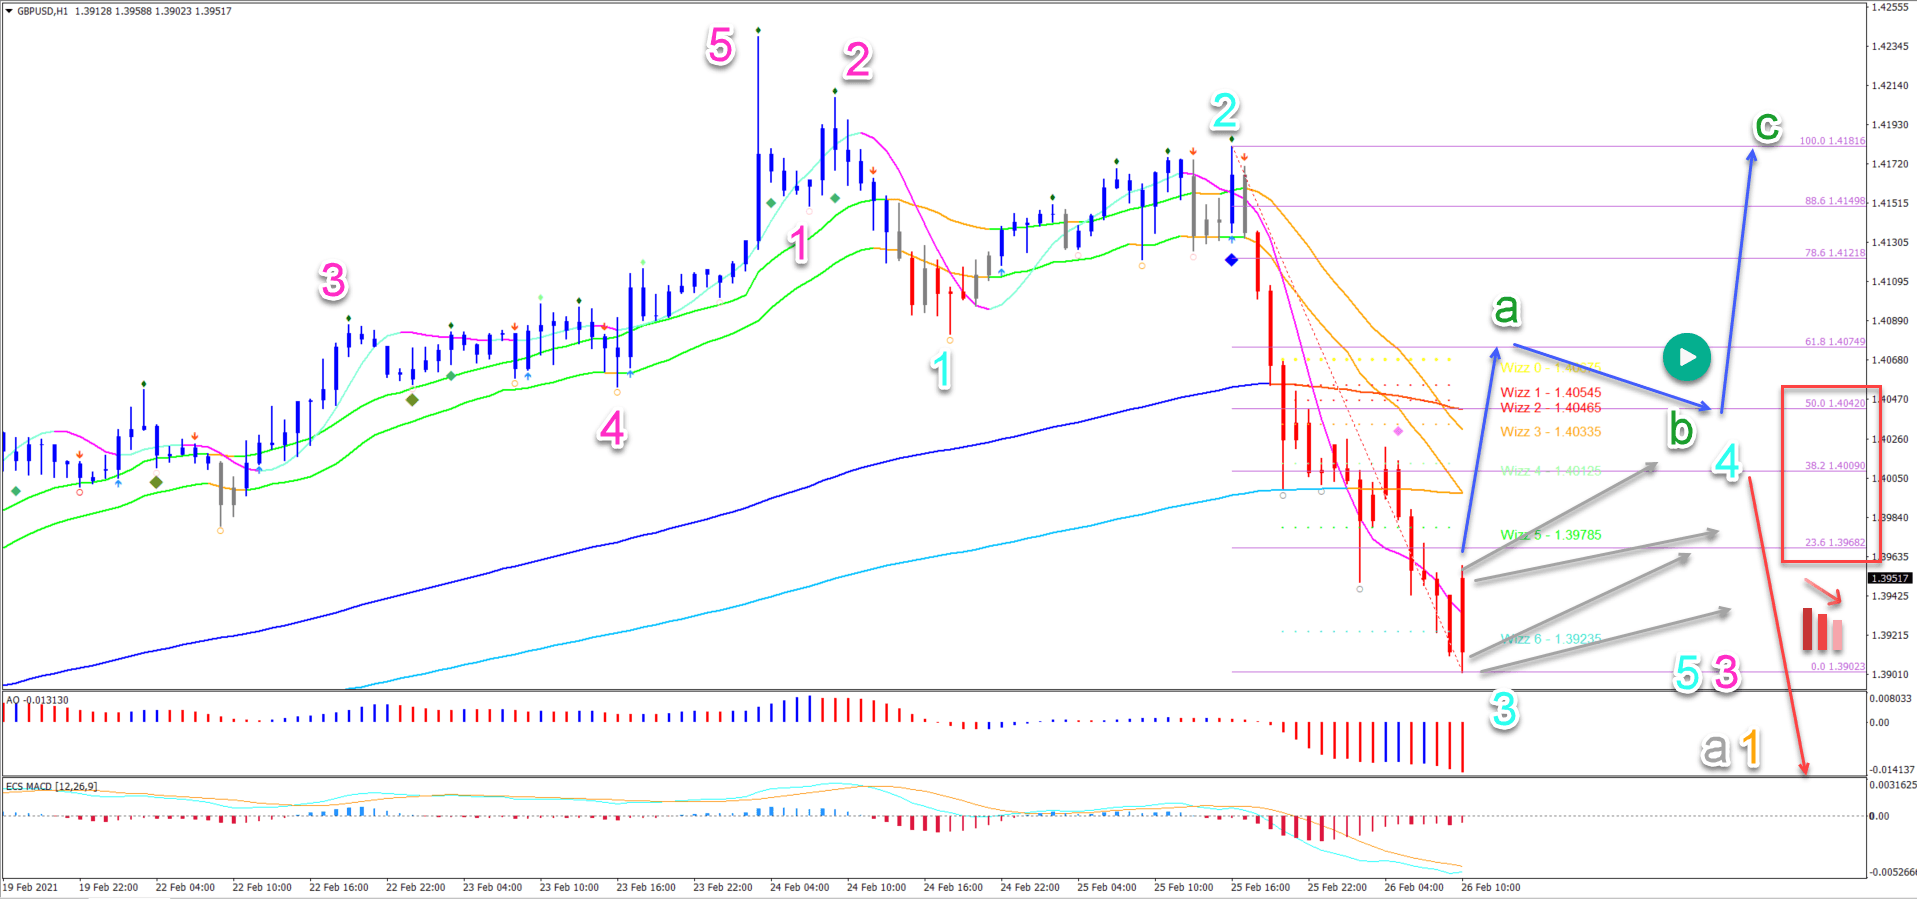
On the 1 hour chart, we can see the difference in expectations. Both scenarios are equally possible from a wave analysis point of view.
A strong bullish bounce could create a bullish ABC up (blue arrows).
Whereas a bear flag (grey arrows) should send the GU pair lower again (red arrow) in a wave 345 (light blue).