
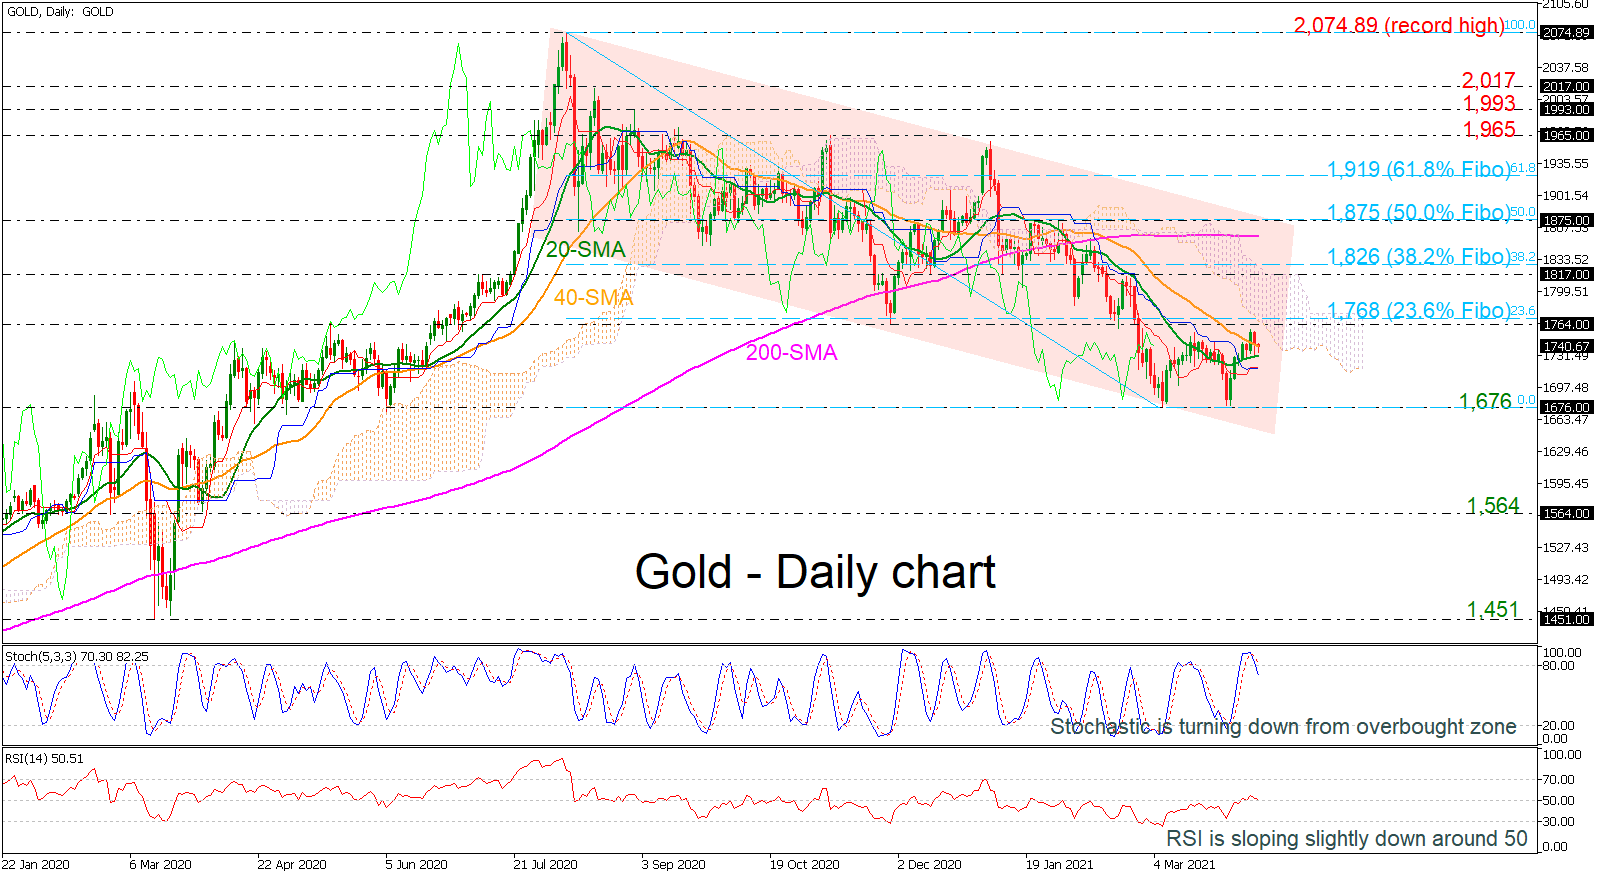
The gold price has been trading within a downward sloping channel over the last eight months, after the market reached the record high of 2,074.89. Currently, the rebound off the 1,676 support is helping the yellow metal to hold within the channel and around the short-term moving averages.
From the technical perspective, the stochastic is heading south, following the bearish cross within the %K and %D lines, while the RSI is pointing down near the neutral threshold of 50.
In case of a slip beneath the 20- and 40-day simple moving averages (SMAs), that could open the way for a retest of 1,676 before falling victim to steeper declines towards the next support of 1,564, taken from the trough of April 2020.
In the positive scenario, a successful attempt beyond the 1,764 resistance and the 23.6% Fibonacci retracement level of the downward wave from 2,074.89 to 1,676 at 1,768 could be crucial for the bulls. Overcoming these obstacles, 1,817 and the 38.2% Fibonacci of 1,826 could be the mid-level of the channel ahead of the 200-day SMA at 1,858.
Summarizing, the precious metal is negative in the broader outlook, however, the bounce off 1,676 is still in place in the very short-term.


