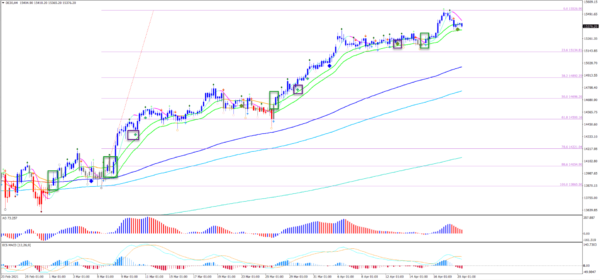
- On the 4 hour chart below, we can see how the moving averages help us identify the moments when price action is making a pullback within the uptrend.
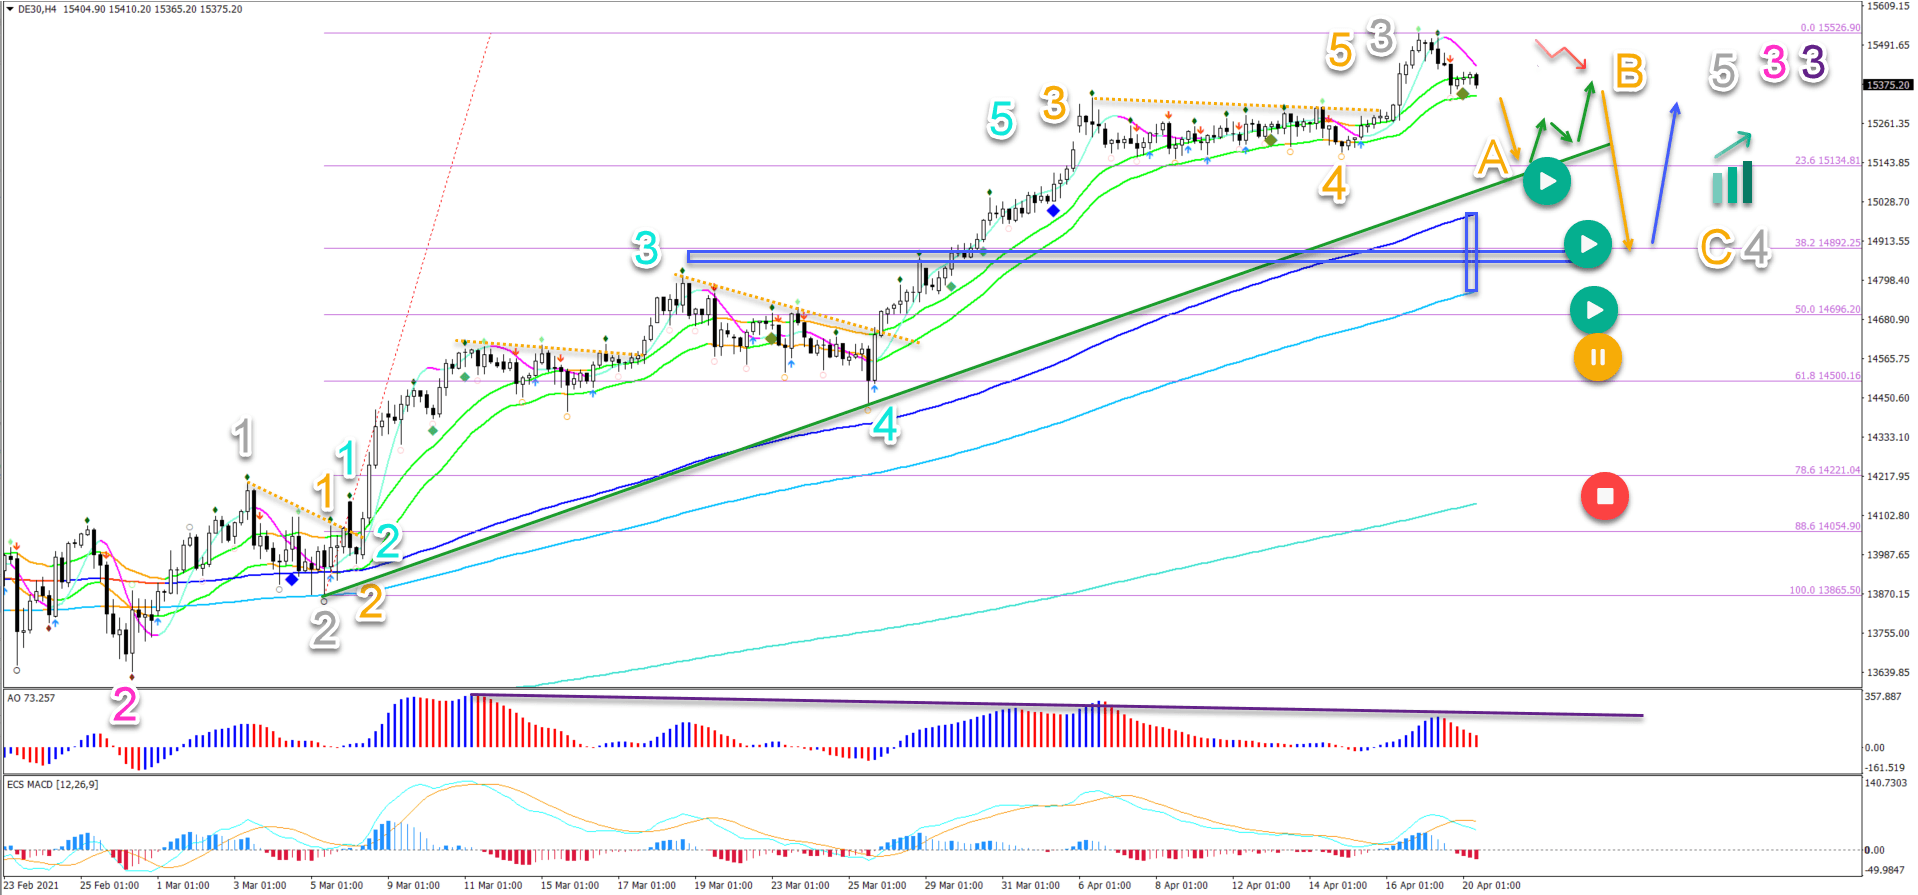
- German stock index DAX 30 (DE30) has been in a major uptrend since the bullish reversal from March 2020. The uptrend remains valid but a bearish pullback is likely.
- A divergence pattern, however, is visible between the tops (purple line on AO). The double divergence usually indicates a higher chance of a bearish retracement.
This article reviews what to expect from the retracement and when the uptrend should resume. Let’s start.
Price charts and technical analysis
The DAX 30 chart is showing a clear uptrend on the 4 hour, besides the strong daily uptrend as well. The price action is above the 21 ema zone, which is above the long-term moving averages such as the 144, 233, and 610 ema close:
- A divergence pattern, however, is visible between the tops (purple line on AO). The double divergence usually indicates a higher chance of a bearish retracement.
- The usual target of the divergence pattern is around the 144 ema close.
- In this case, price action might push a little bit lower and make a decline towards the 38.2% Fibonacci retracement level of wave 3 (grey).
- The current wave patterns suggest a wave 3 (grey) of waves 3 (pink/purple). The pullback therefore could be a potential wave 4 (grey).
- A bearish breakout below the 21 ema zone could confirm the bearish wave A (orange) of wave 4 (grey).
- A bullish bounce and ABC pattern at the 23.6% Fib could indicate a wave B (orange) followed by another price swing lower towards the 38.2% Fib and 144 ema within wave C (grey).
- This wave analysis remains valid as long as price action stays above the 50% Fib. A break below the 50% places it on hold (yellow) and deeper retracement invalidates (red).
- A strong bullish bounce (blue arrow) indicates the end of the bearish correction and the potential restart of the uptrend.
On the 4 hour chart below, we can see how the moving averages help us identify the moments when price action is making a pullback within the uptrend.
- The breakouts (green box) above the 21 ema zone signals a continuation of the trend. This is certainly valid when all the moving averages are aligned to one direction. In this case, all of them are pointed upward.
- The bullish push away from the 21 ema zone indicates strong momentum (purple boxes). This happens when price action does not hit the 21 ema high or low.
- But with a divergence pattern visible, the 21 ema is not expected to offer strong support anymore in this uptrend. And usually, there is a retracement that goes to the 144 ema.
- A break below the 21 ema zone could indicate the end of the immediate uptrend and a push to the 144 ema.
- A bullish bounce is expected to take place around the 144 ema because of the strong uptrend.