- Dow Jones Index (DJI or US30) uptrend remains strong with a perfect trend alignment. This means that price is above the 21 emas, which is above the 144 ema.
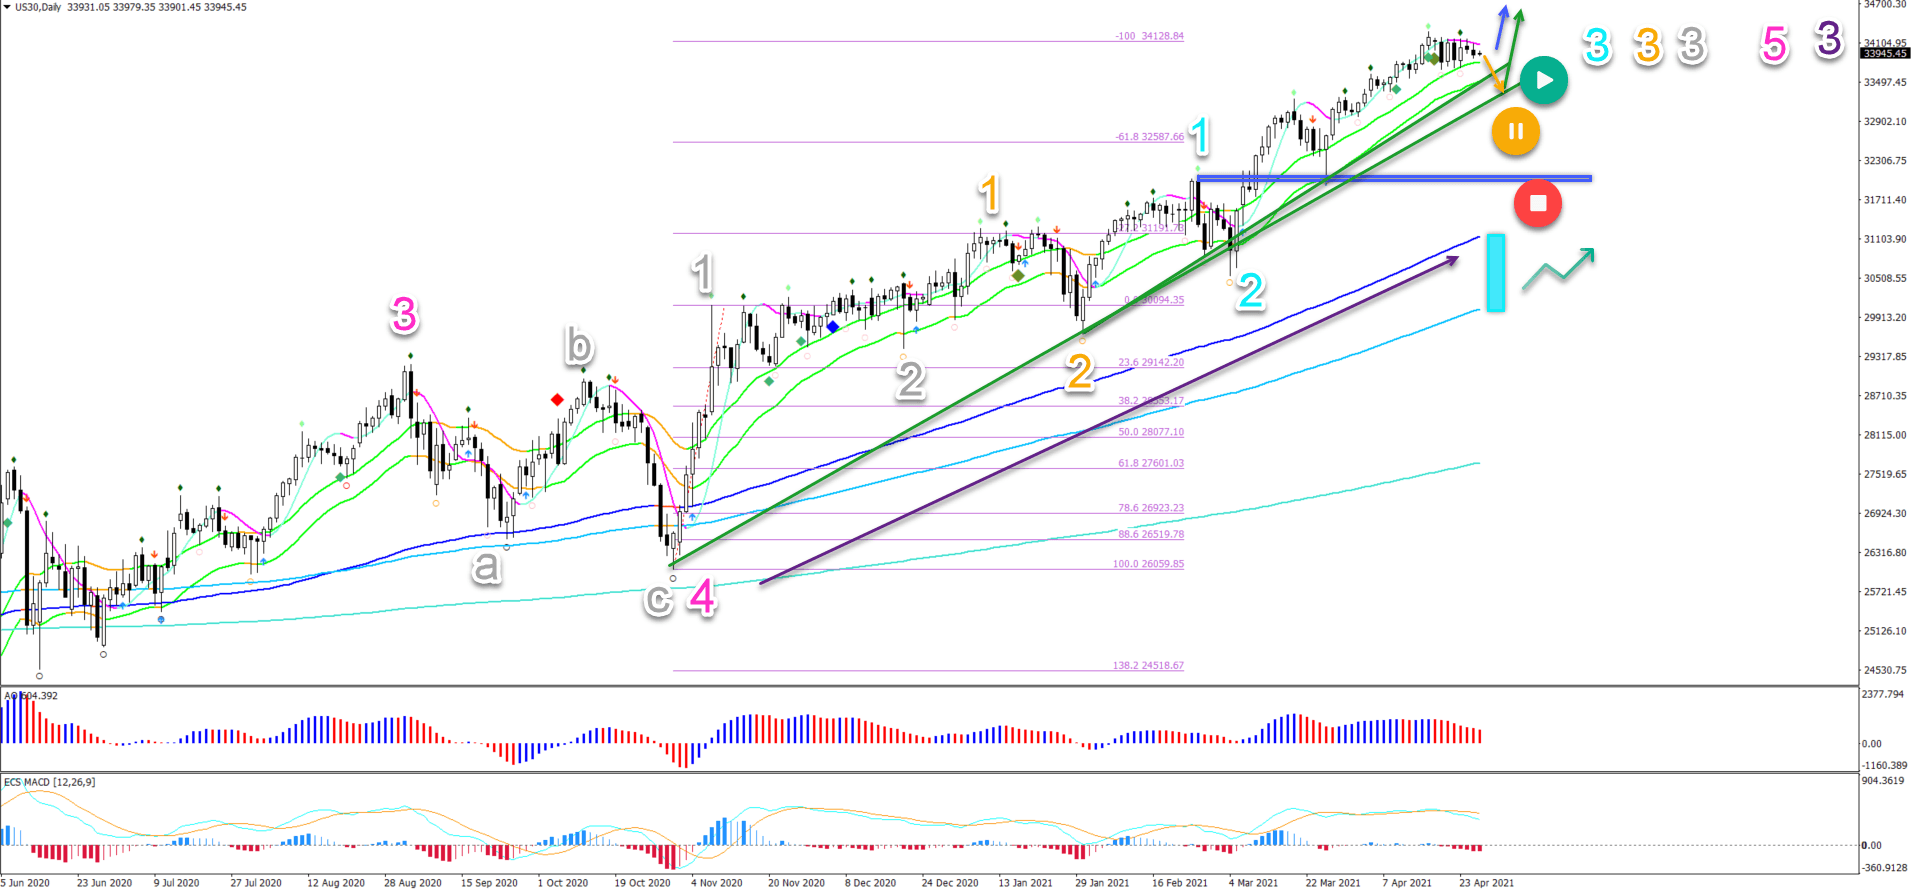
- The US30 daily chart has 7 daily candles that we’re unable to break for a higher high. This certainly indicates a small pause and indecision within the uptrend.
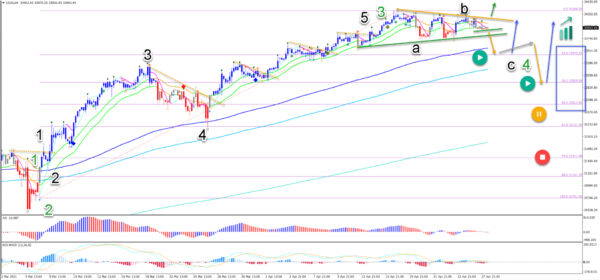
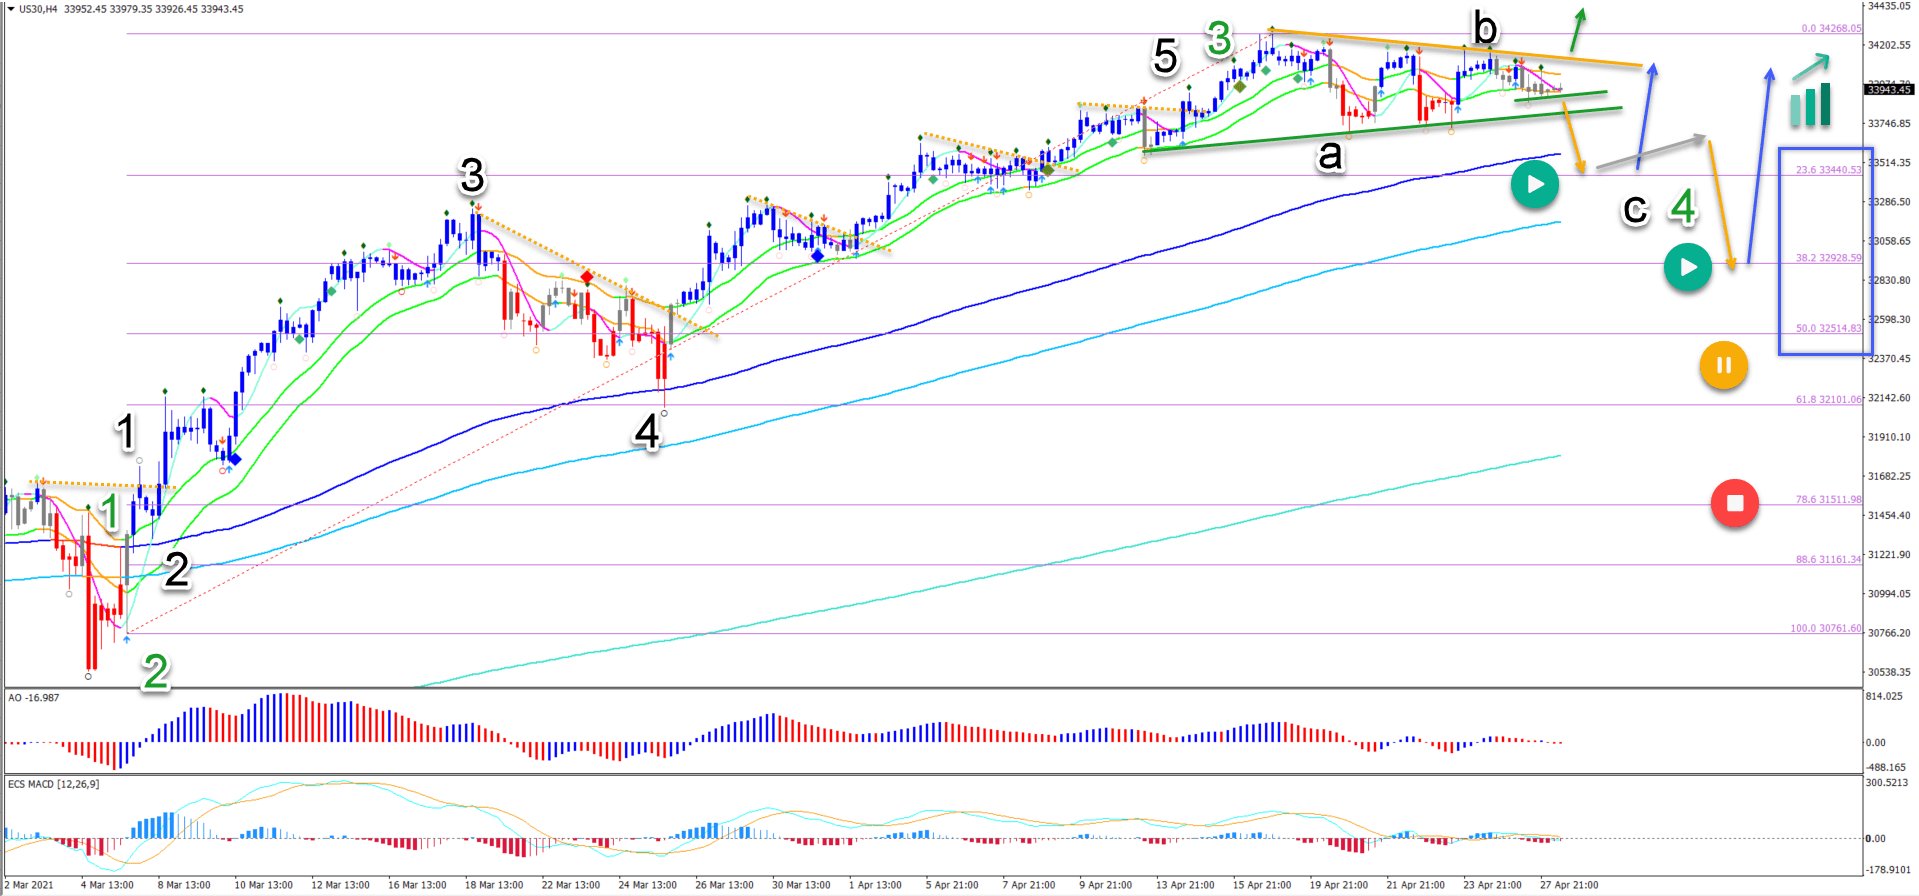
- On the 4 hour chart, we can see the bullish wave outlook if the pullback is shallow and the waves 3 remains valid.
In this article, we will analyze where the uptrend could continue. Or are the bulls running of steam? Let’s start.
Price charts and technical analysis
The US30 daily chart has 7 daily candles that we’re unable to break for a higher high. This certainly indicates a small pause and indecision within the uptrend:
- However, the moving averages are indicating that the uptrend remains strong. The 21 ema zone is showing a steep angle. Plus the gaps between all of the moving averages are only increasing (purple arrow).
- Price action seems to be in a wave 5 (pink) of a larger uptrend (wave 3 purple) after completing an ABC (grey) in wave (pink).
- The current push-up could be part of waves 3 as long as price action keeps respecting the daily 21 emas. This could occur via a breakout (blue arrow) or after a pullback (orange arrow) and bounce (green arrow).
- A break and close below the 21 ema (orange pauze circle) could indicate the end of wave 5 (pink) whereas a break below the support (red stop circle) makes it likely.
- That said, a strong bearish retracement only invalidates waves 3 but not the entire uptrend because price action could still bounce at the 144 – 233 emas.
On the 4 hour chart, we can see the bullish wave outlook if the pullback is shallow and the waves 3 remain valid:
- The current sideways price action is probably part of wave 4 (green).
- A larger bearish ABC (black) pattern is expected within wave 4 (green).
- The break below the 21 ema zone (orange arrow) could confirm the wave C.
- A retracement lower will probably aim at the 23.6% and 38.2% Fibonacci levels.
- A bear flag (grey arrow) could indicate a deeper push lower (orange arrow).
- A bullish bounce (blue arrows) at these Fib levels could indicate the end of 4 (green).
- Only a break below the 50% Fib places this on hold (orange) or invalidates it (red).