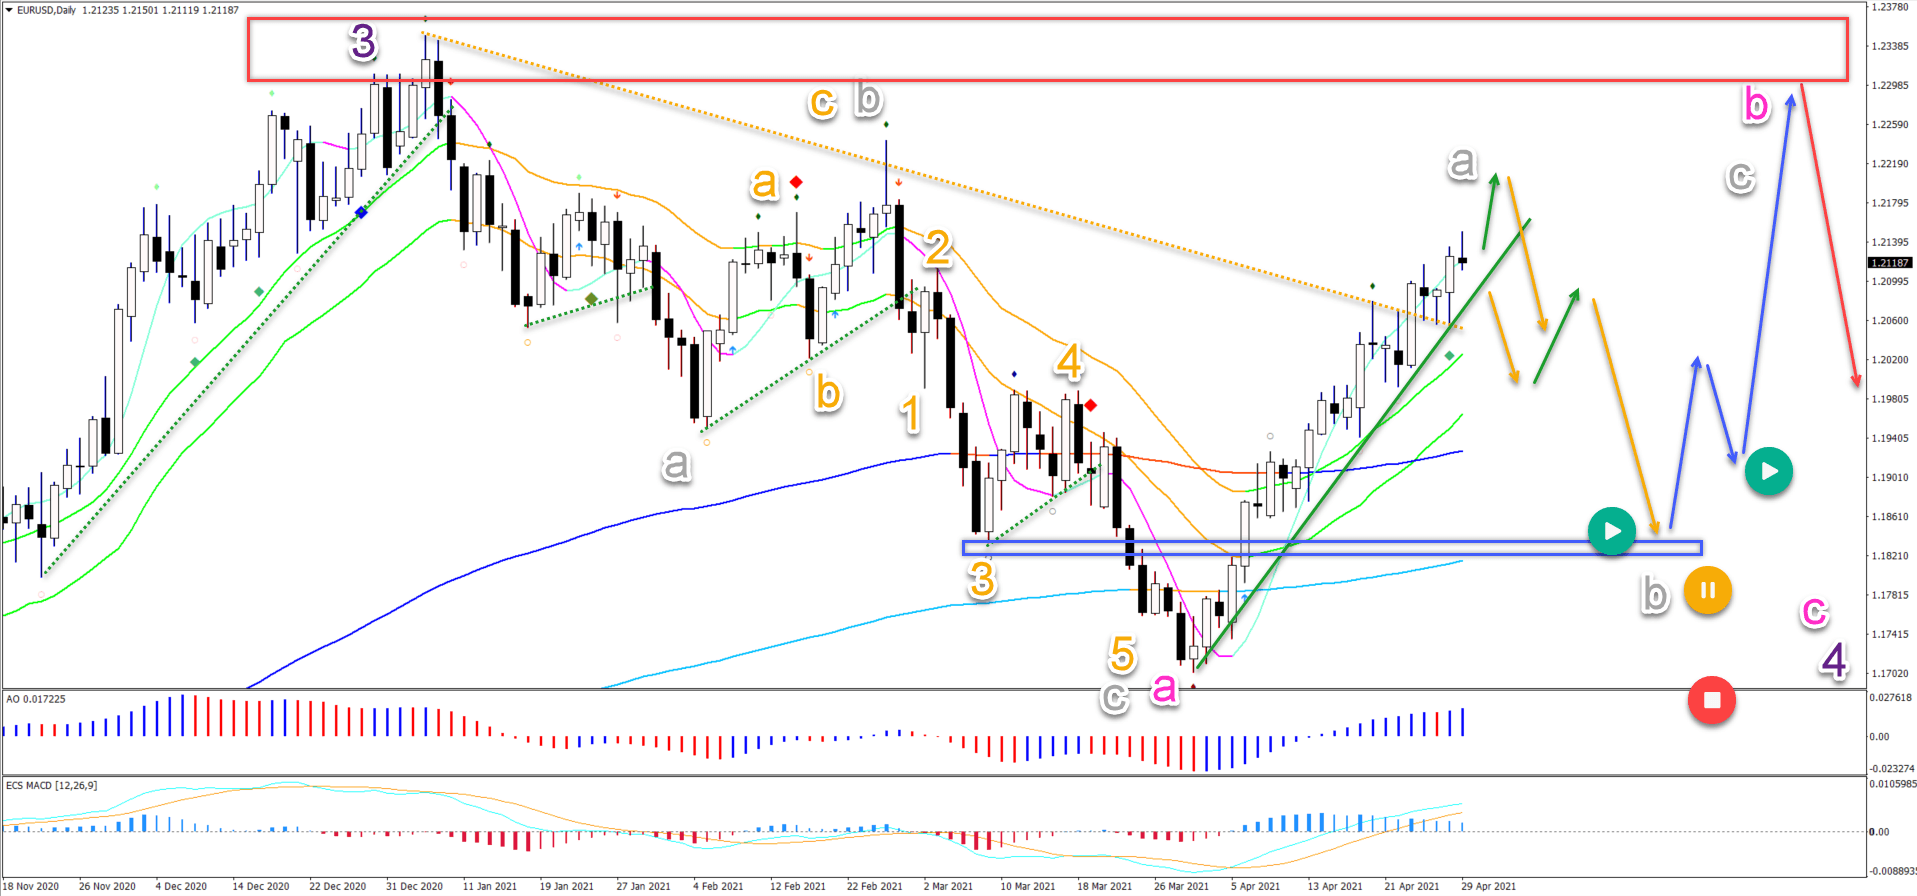
- Despite the bullish breakout above the resistance trend line (dotted orange), price action is reaching a resistance zone that could send price lower again. Let’s review.
- The EUR/USD wave patterns indicate that the current bullish swing is probably a wave A (grey) of a larger ABC in wave B (pink).
- A strong bearish push could confirm a reversal lower finally whereas a bullish bounce at the 21 ema zone and Fibonacci levels could indicate another bullish swing.
The EUR/USD showed more strength yesterday after the FOMC statement by the US Central Bank (FED), which indicated no substantial changes for the next year or two.
 Price charts and technical analysis
The EUR/USD wave patterns remain the same for the moment. The current bullish swing is probably a wave A (grey) of a larger ABC in wave B (pink).
- We expect that the wave A (grey) could run out of steam soon. Either now (orange arrow) or a bit higher around 1.22-1.2250 (green arrow).
- The breakout below the support trend line (green) could confirm a bearish ABC pattern.
- The main target of the bearish ABC is the support level (blue box) that could create an inverted head and shoulders level (blue arrows).
- This ABC (pink) could complete a wave 4 (purple).
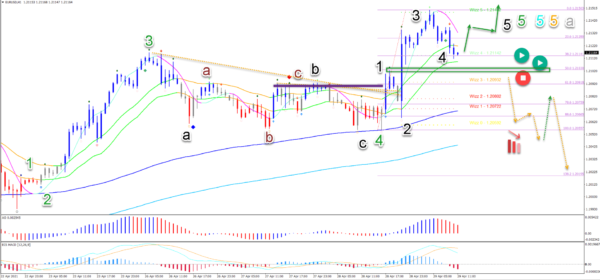
On the 1 hour chart, price action made another push up. This invalidated our bearish analysis yesterday. But despite our bearish view, the confirmation of the breakout on the 4 hour chart never occurred. Instead price action broke above the Fractals (purple box), which we indicated were key for one more bullish push up. This is why using confirmation and invalidation is critical for trading and we can see its purpose this week:
- Now price action could be in a final wave 5 of wave 5 on 3 higher degrees.
- But price action must remain above the top of wave 1, otherwise this final 5th wave is invalidated.
- A strong bearish push (orange dotted lines) could confirm a reversal lower finally.
- A bullish bounce at the 21 ema zone and Fibonacci levels could indicate another bullish