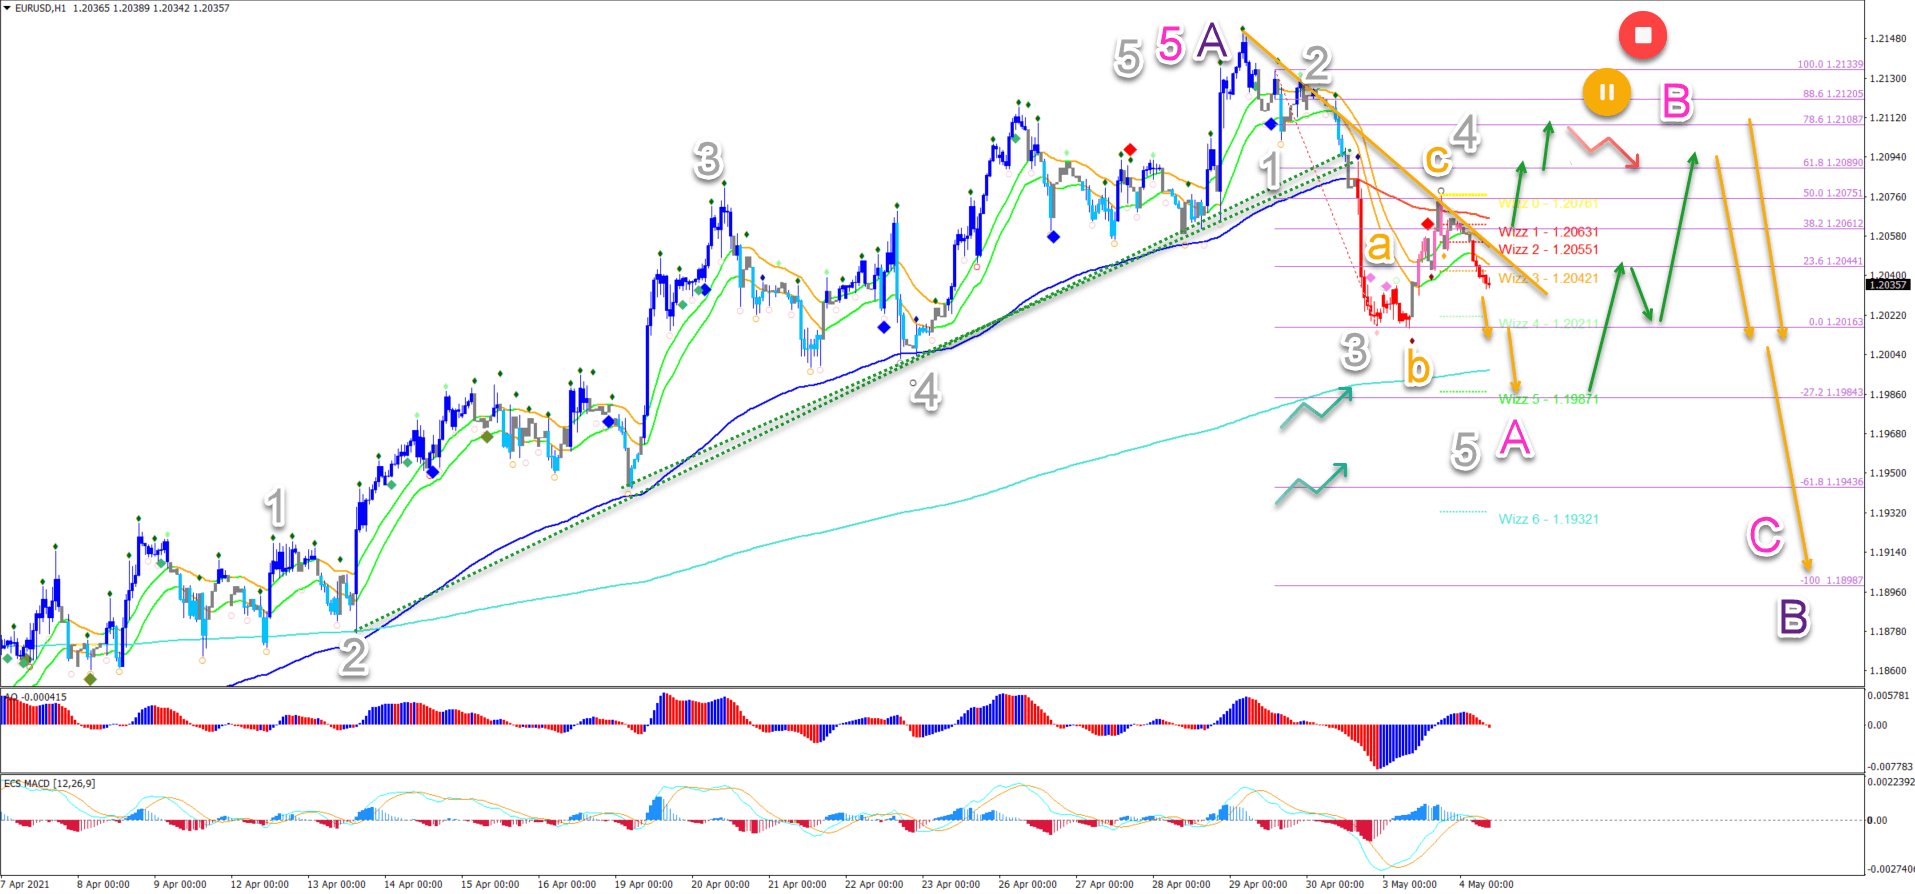
- EUR/USD broke the support trend line (dotted green) after completing 5 strong bullish waves.The old uptrend has been replaced by a new downtrend.
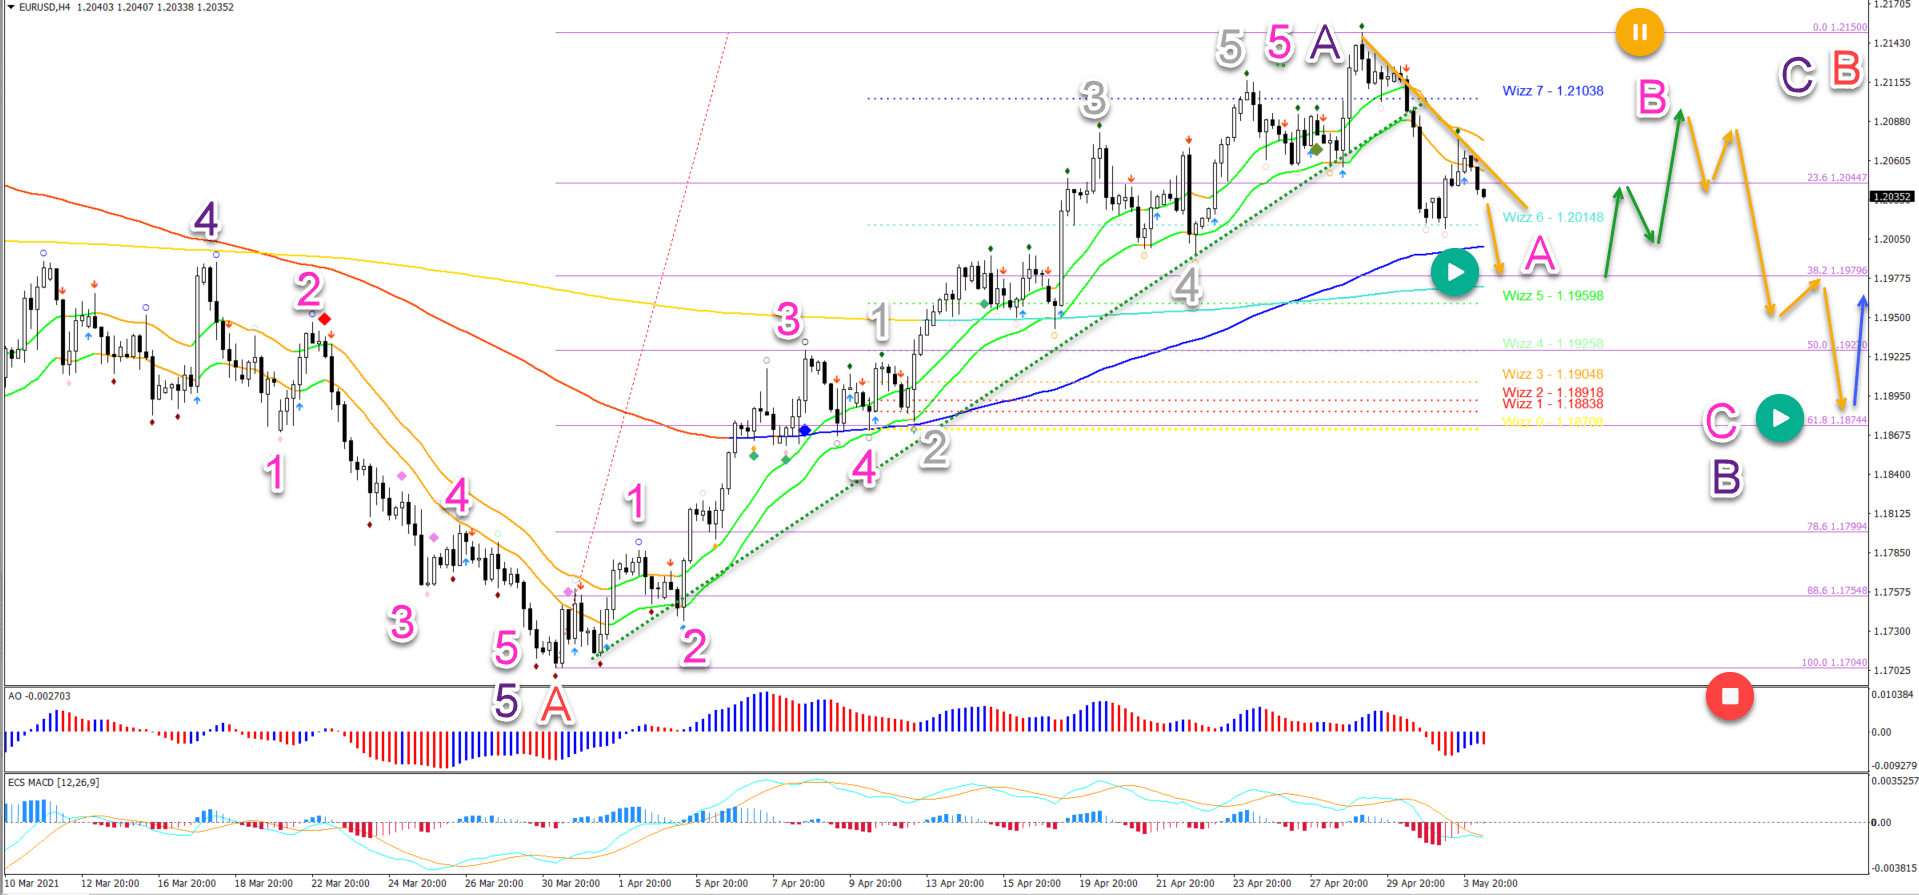
- The EUR/USD seems to have completed 5 waves (grey) of wave 5 waves (pink). This price swing is probably a wave A (purple) of a larger ABC (purple) zigzag correction.
- On the 1 hour chart, price action has broken below the support trend lines (dotted green) and the 144 ema, which is indicating a shift from an uptrend to a downtrend.
This article analyses what to expect from the price and wave patterns. We also review key targets and decision zones.
Price charts and technical analysis
The EUR/USD seems to have completed 5 waves (grey) of wave 5 waves (pink). This price swing is probably a wave A (purple) of a larger ABC (purple) zigzag correction. The ABC could fit within a wave B (red) of a larger ABC (red) pattern:
- If price action is going to move lower in wave B (purple), then it will likely create an ABC (pink) pattern downwards.
- Usually speaking, wave A (pink) of zigzag finishes at the 38.2% Fib and 144 ema close.
- A 3 wave bounce (green arrows) from the support could confirm wave B (pink).
- A bearish reaction (orange arrow) at the resistance zone could confirm wave C (pink).
- The main target of the wave C is the 61.8% Fibonacci level. This is where wave B (purple) could end and wave C (purple) could start (blue arrow).
- A break below the bottom invalidates this wave outlook. A break above the top places it on hold and could indicate an uptrend or a different type of correction in wave B (purple) – for instance not a zigzag but an ABC flat.
On the 1 hour chart, price action has broken below the support trend lines (dotted green) and the 144 ema, which is indicating a shift from an uptrend to a downtrend:
- The bearish bounce at the 50% Fibonacci level seems to complete a bullish ABC (orange) pattern in wave 4 (grey).
- A lower low could confirm the wave 5 (grey) in wave A (pink) at the Wizz 5 and -27.2% Fib target.
- A bullish bounce (green arrows) could indicate the wave B (pink).
- A break above the resistance trend line (orange) and the 144 ema could indicate that the wave 4 and 5 (grey) of A (pink) has already been completed. Price could move up to the Fibonacci levels.
- Only a deep push-up invalidates this temporary bearish wave analysis.