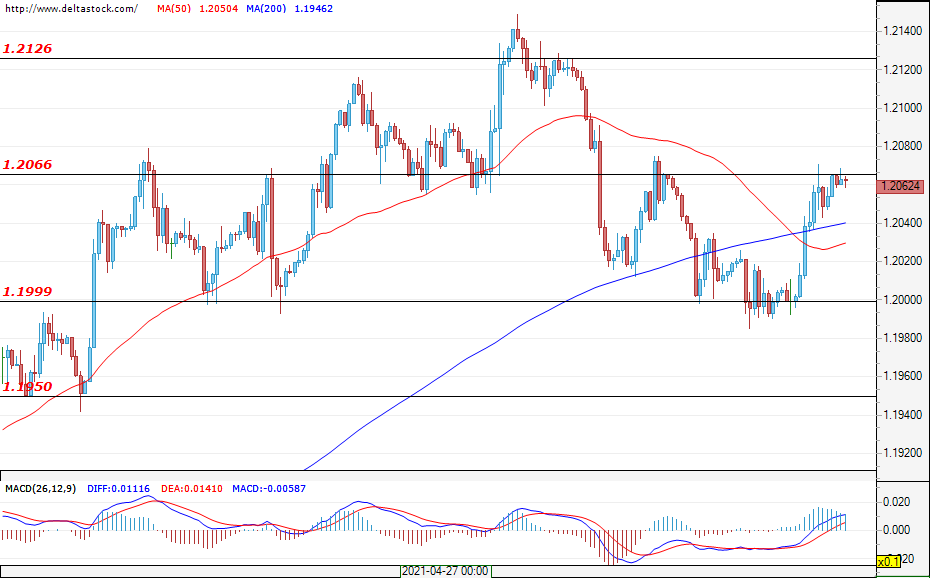
EUR/USD
Current level – 1.2062
The pair managed to find solid support around 1.2000, and the area can be considered the bottom of the corrective move that started from 1.2140. The first resistance at the time of writing the analysis is the 1.2066 zone. This level may not be breached on the first try. It is possible that the bears will make a final move, which is expected to be limited to the area between 1.2020 and 1.2000. This would allow the bulls better entry levels. Additionally, the rally in EUR/USD is expected to renew, with first targets at around 1.2126 and 1.2180. Today, investors will closely monitor the upcoming data from the United States at 12:30 GMT on the monthly non-farm payrolls, with most forecasts suggesting about 1 million new jobs.
| Resistance | Support | ||
| intraday | intraweek | intraday | intraweek |
| 1.2066 | 1.2180 | 1.1200 | 1.1950 |
| 1.2126 | 1.2270 | 1.1950 | 1.1880 |
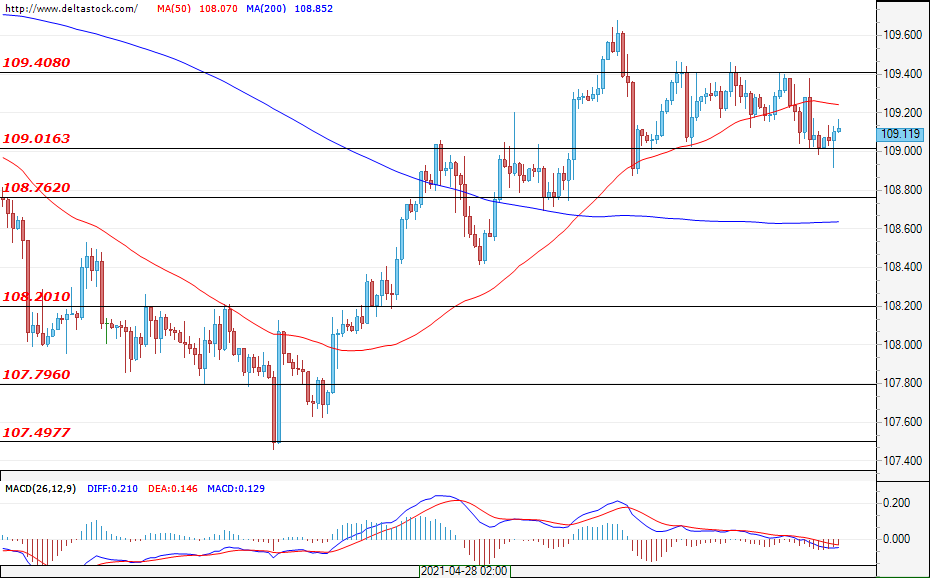
USD/JPY
Current level – 109.21
The currency pair managed to stay above the key support at 109.05 and this is a strong signal for continued upward movement. However, expectations are for a second test at this level and if it is passed again, then investors’ expectations will be positive for a test of the significant resistance at 109.73.
| Resistance | Support | ||
| intraday | intraweek | intraday | intraweek |
| 109.40 | 110.52 | 109.00 | 108.20 |
| 109.60 | 110.52 | 108.76 | 107.80 |
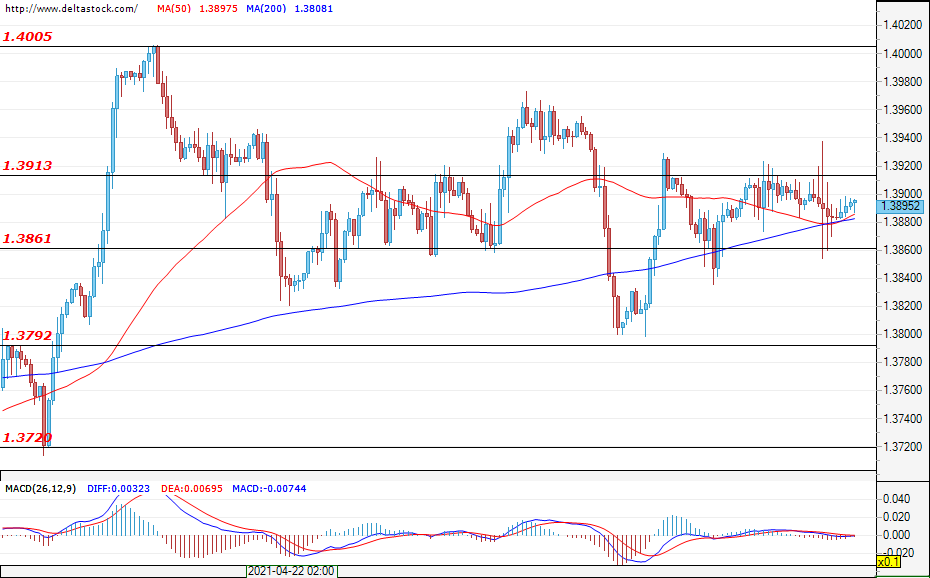
GBP/USD
Current level – 1.3895
Yesterday’s unanimous decision by the Bank of England to not change interest rates and quantitative easing failed to help the market find direction. Despite the increased activity, prices are again at the consolidation zone around 1.3900. The support zone at 1.3860-40 was tested again, as the bulls managed to defend their ground. The forecasts remain positive for new gains, and expectations are for a break of local resistance at 1.3913 and a rally towards 1.4000. First support for the bulls is 1.3860, followed by 1.3790.
| Resistance | Support | ||
| intraday | intraweek | intraday | intraweek |
| 1.3920 | 1.4140 | 1.3860 | 1.3720 |
| 1.4000 | 1.4300 | 1.3790 | 1.3670 |