In this technical blog we’re going to take a quick look at the Elliott Wave charts of NZDJPY pair , published in members area of the website. As our members know NZDJPY is showing bullish sequences in the cycle from the March 2020 low . We’ve been calling rally in this forex pair. We recommended members to avoid selling in any proposed pull back and keep buying the dips in 3,7,11 swings. Recently NZDJPY made a 3 waves pull back that have given us a good buying opportunity . In the further text we are going to explain the Elliott Wave Pattern Forecast and Trading Strategy.
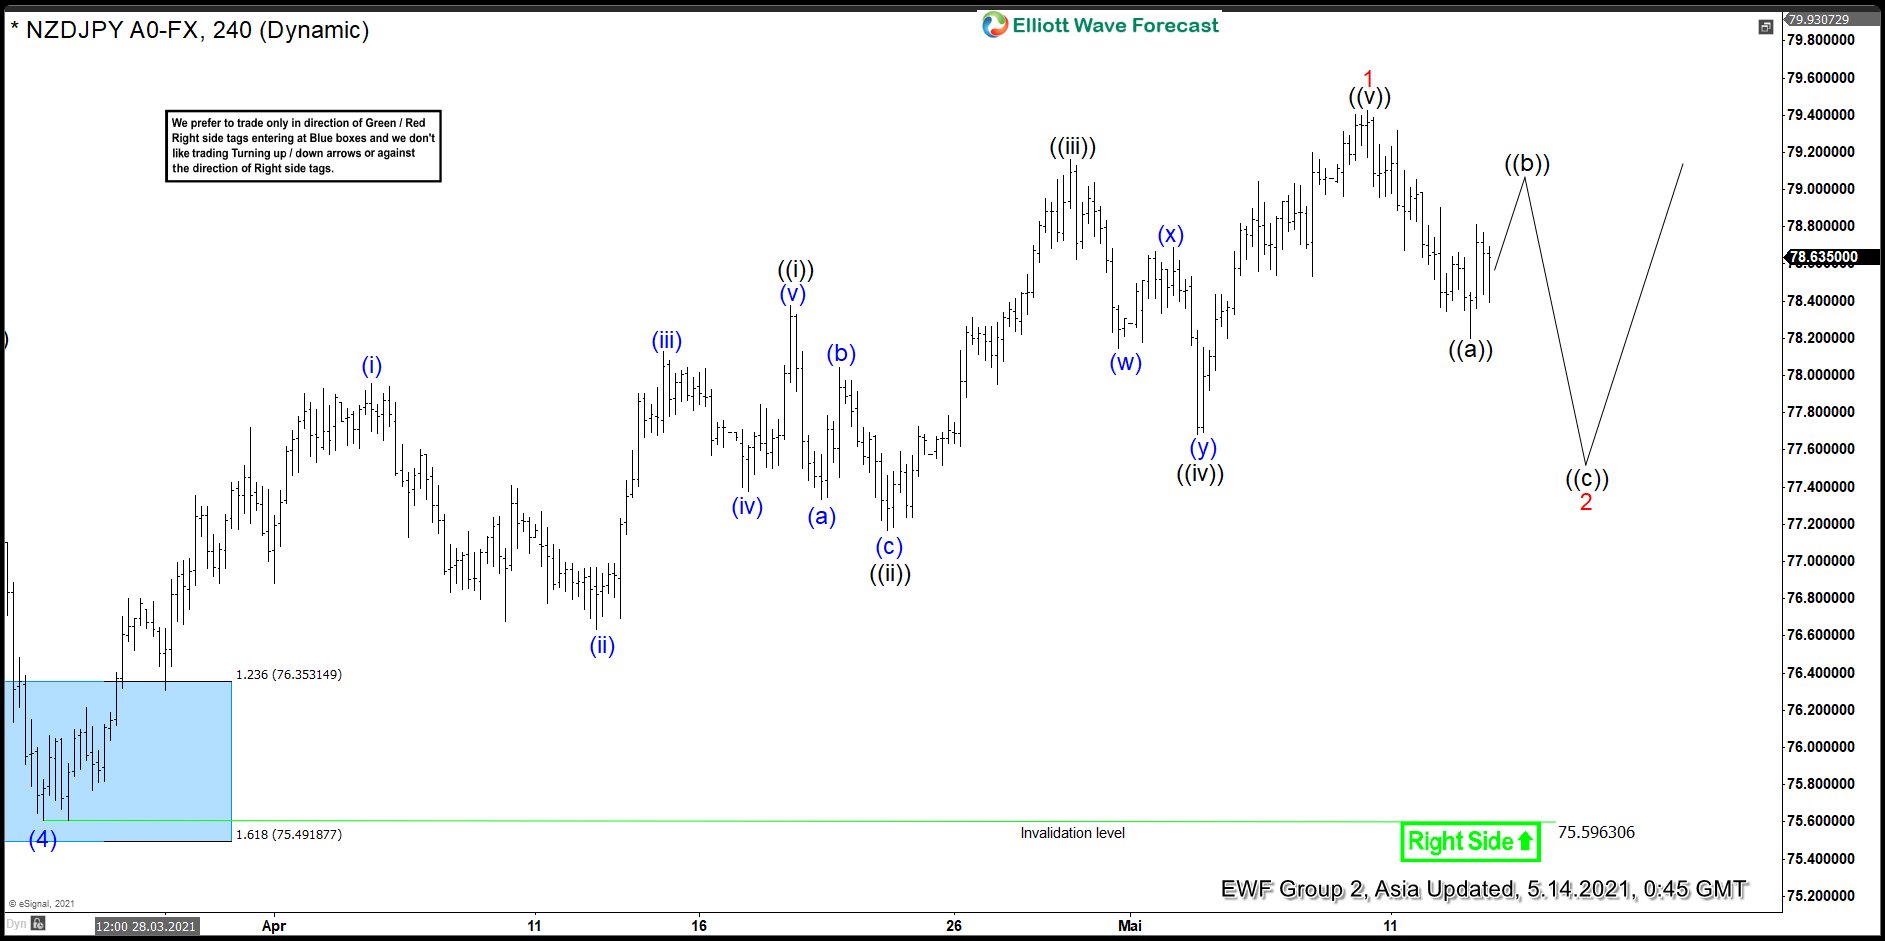
NZD/JPY Elliott Wave 1 Hour Chart 5.14.2021
The pair ended short term cycle from the 75.59 low as 5 waves structure. We assume 2 red pull back is in progress , having scope to reach approximately 50-61.8 fibs against the mentioned low. The pair made 5 waves down from the peak., suggesting we got only first leg of the pull back for now. We would need to wait for ((b)) bounce to complete, before we could measure ((a))-((b)) equal legs area, which will be potential buying zone. Don’t recommend selling the pair in any proposed leg down and favor the long side against the 75.59 low.
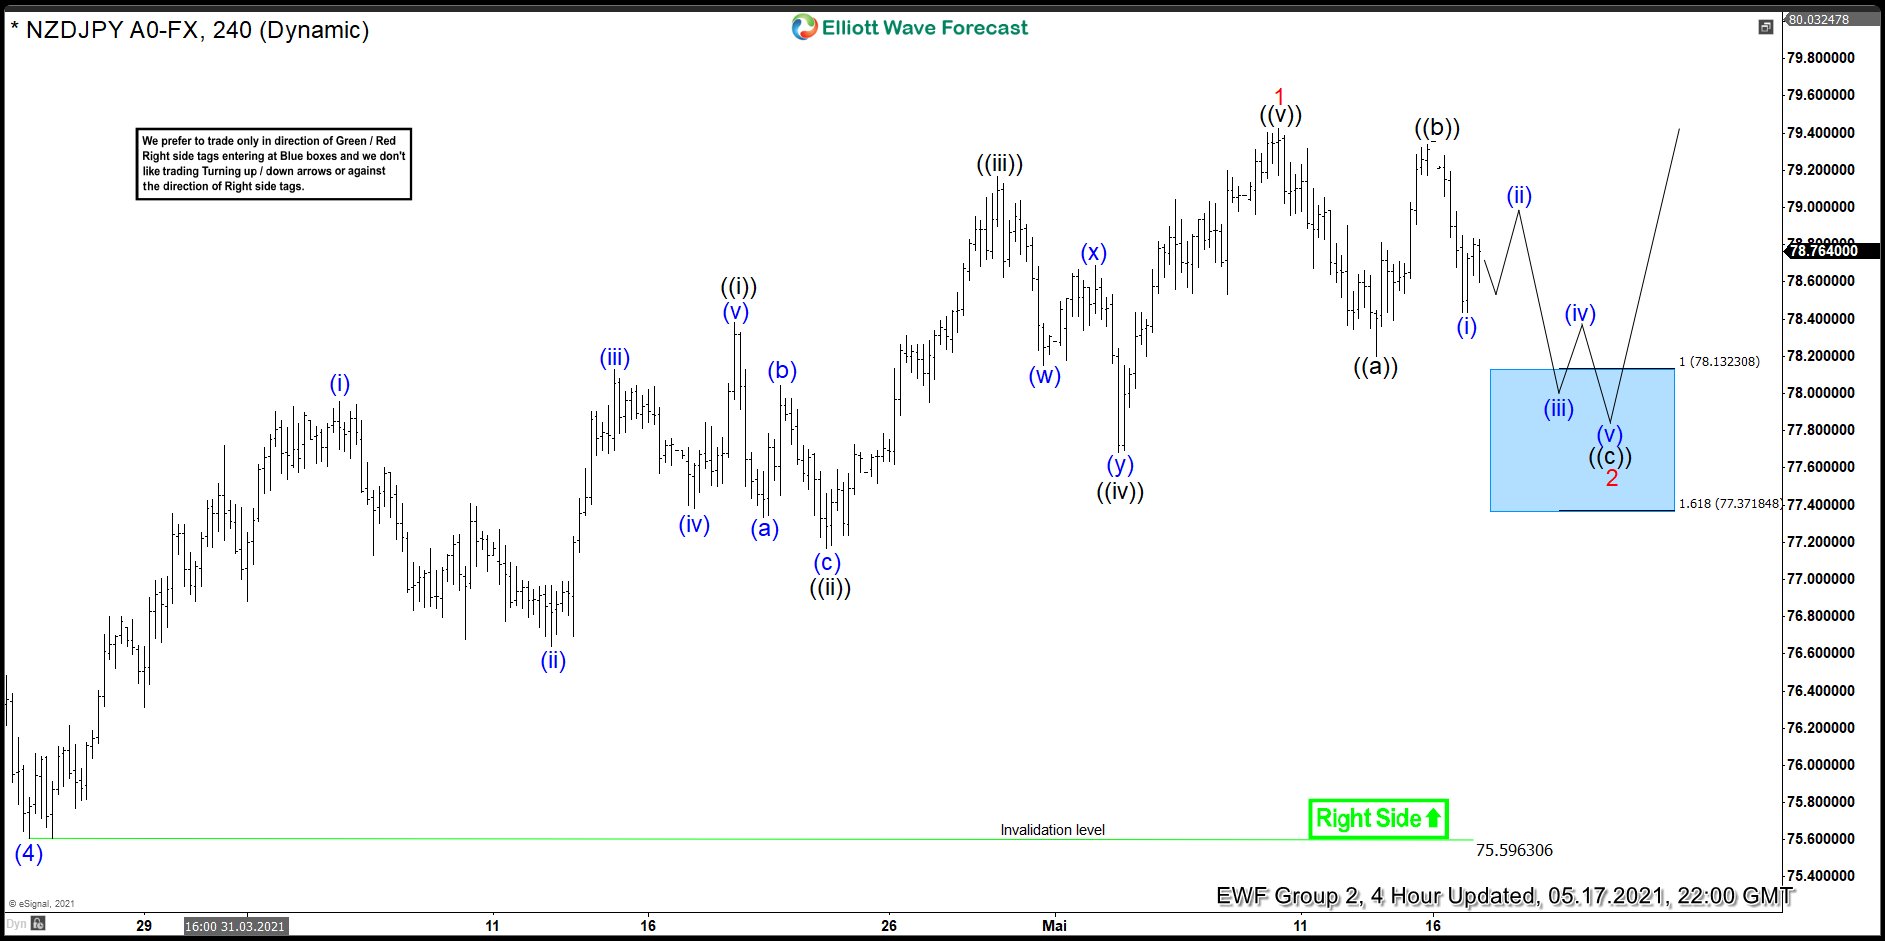
NZD/JPY Elliott Wave 1 Hour Chart 5.17.2021
The pair ended correction- ((b)) wave and now we are able to measure extreme zone, which will be good area to enter long positions. We believe that ((c)) leg is in progress toward 78.13-77.37 area, where we would like to be buyers. We don’t recommend selling and favor the long side from the mentioned zone. As the main trend is bullish we expect buyers to appear for 3 waves bounce at least. Trading strategy is waiting for Equal legs: 78.13-77.37 (Blue Box) to be reached before buying the pair. As our members know, Blue Boxes are no enemy areas , giving us 85% chance to get a bounce.
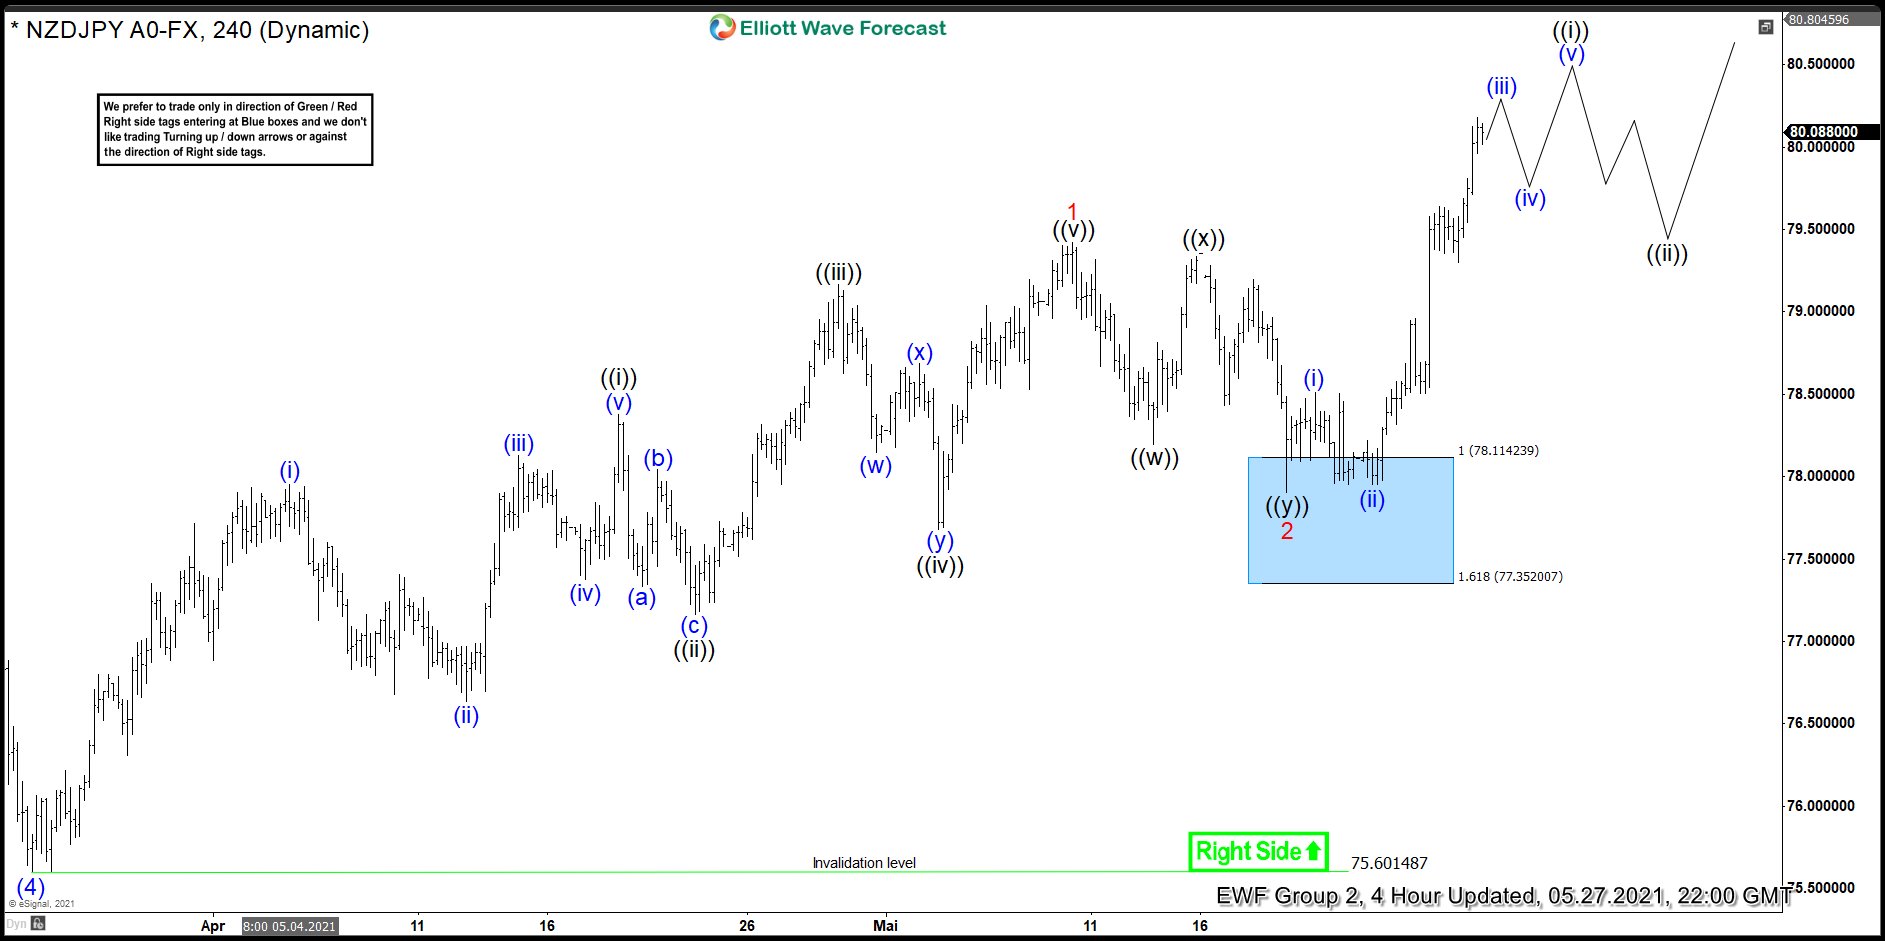
NZD/JPY Elliott Wave 1 Hour Chart 5.17.2021
The pair made more downside toward the blue box as expected. Buyers appeared there and got nice rally. Pull back 2 red ended at 77.91 low. Eventually the price has broken previous peak 05/10 , confirming next leg up is in progress. Right side remains the long side. We don’t recommend selling the pair in any proposed pull back and favor the long side. The pair is expected to keep finding buyers in 3,7,11 swings against the 05/19 pivot in first degree.