
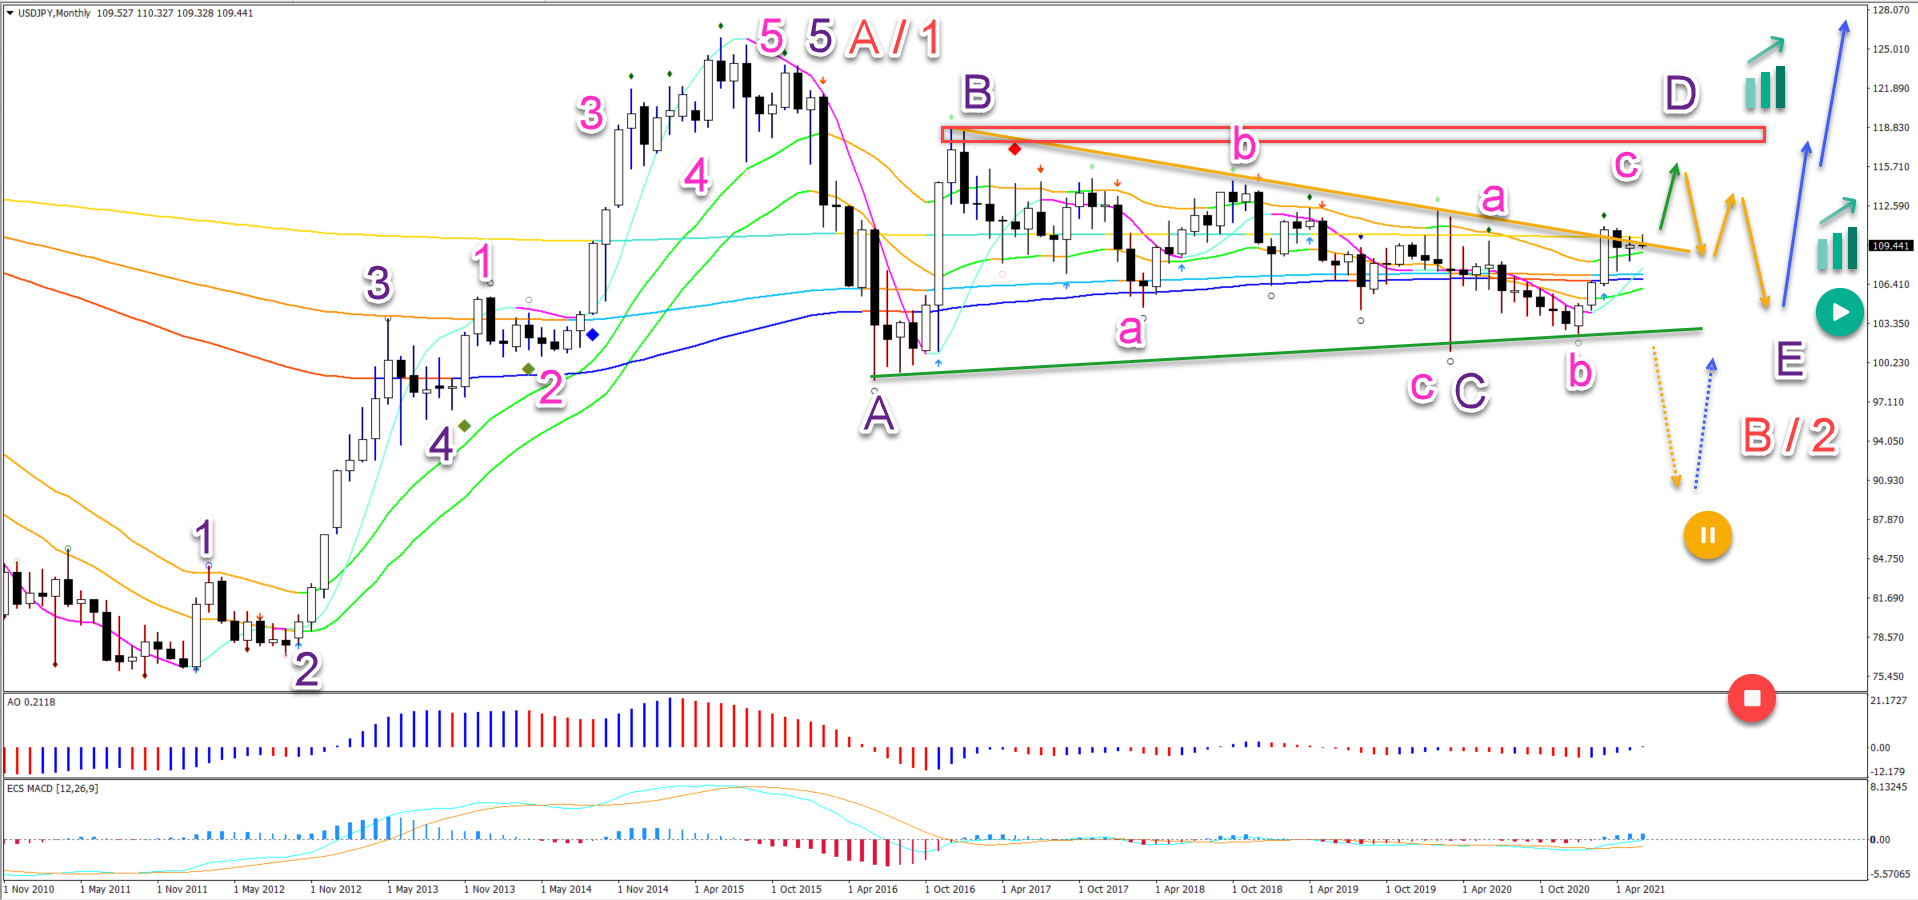
- USD/JPY has been in a range for several years. Price action is probably unfolding in an ABCDE triangle chart pattern (purple).
- The USD/JPY seems to have completed 5 bullish waves in a wave A or 1 (red). The current correction could be an ABCDE pattern in the wave B or 2 pullback (red).
A larger ABC or ABCDE (blue) correction could take place in wave 4 (green) as long as price action remains above the 61.8% Fibonacci level.
Price charts and technical analysis
The USD/JPY seems to have completed 5 bullish waves (purple) in a wave A or 1 (red). The current correction could be an ABCDE (purple) pattern in the wave B or 2 pullback (red):
- A bearish ABC (pink) pattern is completed in wave C (purple).
- Now price action seems to be building an ABC (pink) in wave D (purple).
- A break (green arrow) above the resistance trend line (orange) could confirm it.
- The wave D (purple) remains valid as long as price action remains below the top of wave B (red box).
- The wave E (purple) remains valid as long as price action remains above the bottom of wave C.
- A breakout (dotted orange arrow) below the support trend line (green) invalidates the bearish ABCDE but does not invalidate the wave B or 2.
- Only a break below the bottom invalidates (red circle) the AB or 12 (red).
- A bullish bounce (blue arrow) after an ABC in wave E (purple) could confirm the uptrend.
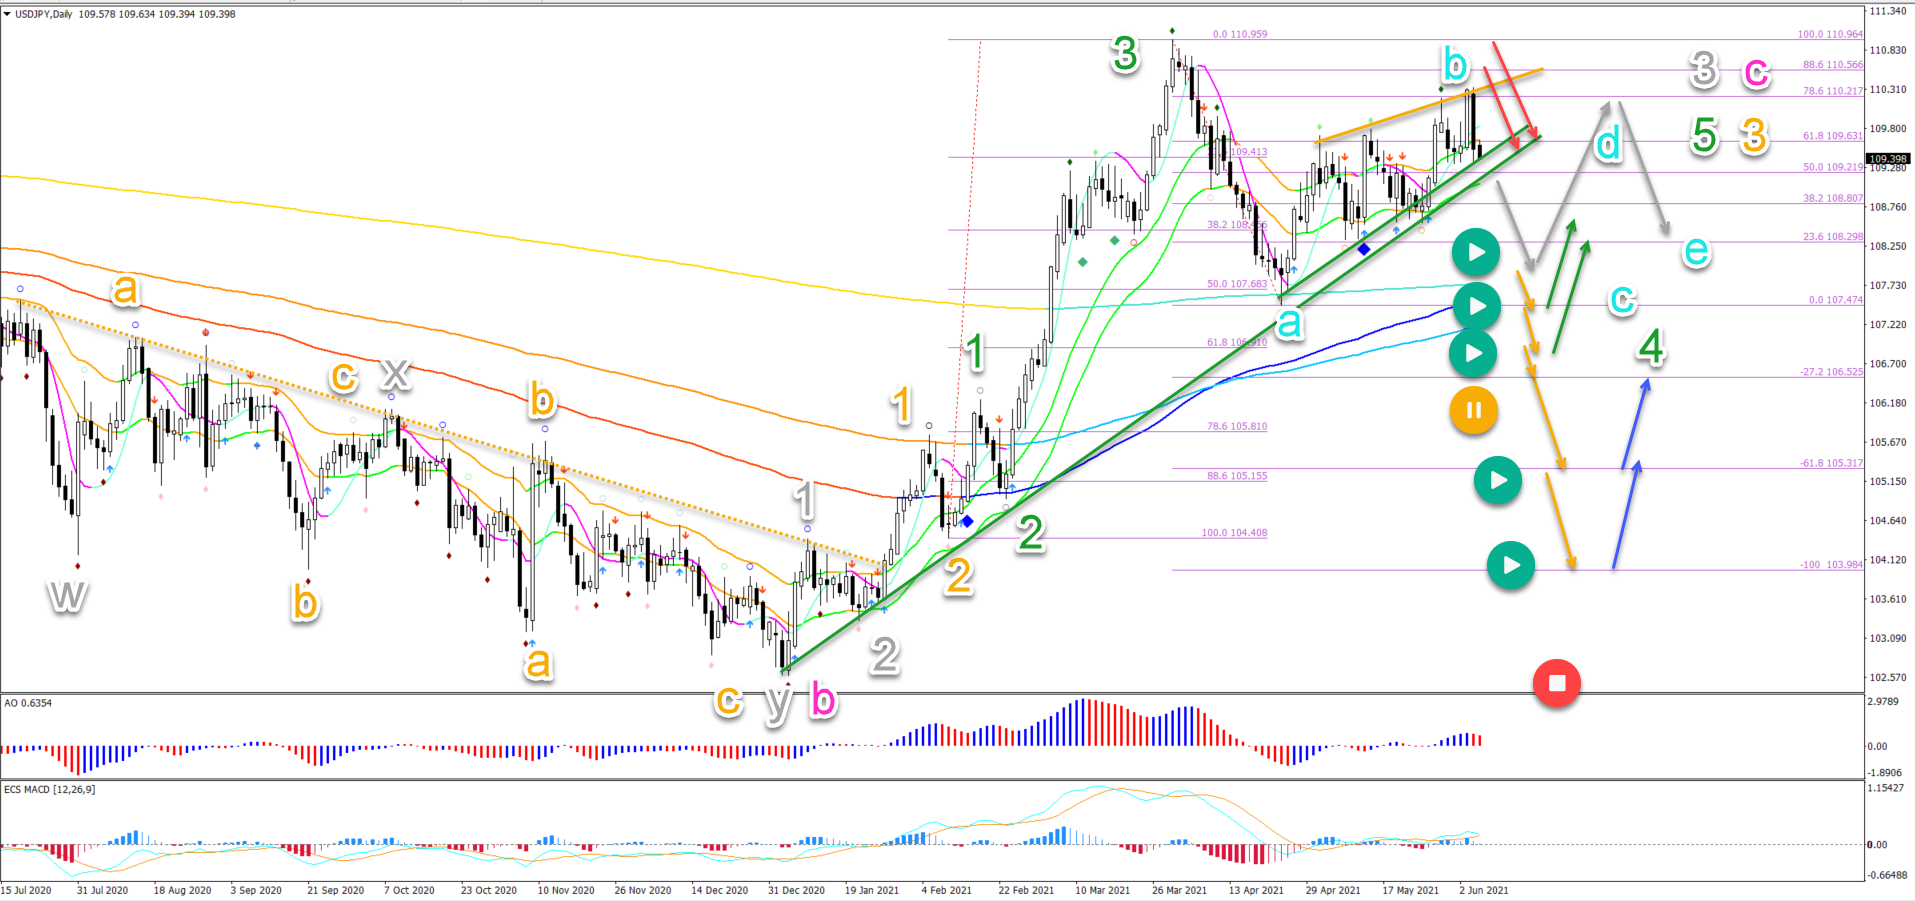
On the daily chart, price action seems to be building a correction after a bullish momentum:
- The bullish impulse is probably a wave 3 (green).
- The pullback is moving sideways, which is typical for a wave 4 (green).
- The bullish price action has been choppy so the current leg is probably a wave B (blue).
- A larger ABC or ABCDE (blue) correction could take place in wave 4 (green) as long as price action remains above the 61.8% Fibonacci level.
- A bearish bounce (red arrows) at the top could indicate a deeper wave B.
- A bearish breakout and bounce above the bottom (grey arrows) could indicate an ABCDE triangle.
- A bearish breakout (orange arrows) below the support (green) and bottom could indicate an ABC (blue) pattern.
- A break below the long-term moving averages and 1.8% Fibonacci levels puts the wave 4 (green) on hold. In that case, a wave C (pink) could have been completed at the recent high and a bearish ABC down is taking place in wave E (purple).


