EURUSD
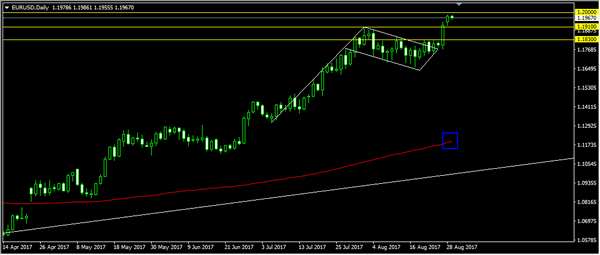
The EURUSD continued its bullish momentum yesterday topped at 1.1983. The bias remains bullish in nearest term testing 1.2000 – 1.2050 region as a part of the bullish continuation scenario after broke above the bullish flag formation as you can see on my daily chart below. Immediate support is seen around 1.1910. A clear break below that area could lead price to neutral zone in nearest term but as long as stay above 1.1830 the overall bullish bias should remain strong and any downside pullback should be seen as a good opportunity to buy. On the upside, a clear break and daily close above 1.2050 would expose 1.2100 – 1.2175 region.
GBPUSD
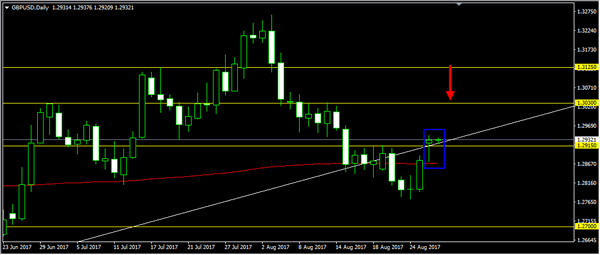
The GBPUSD printed a bullish pin bar formation on daily chart after a rejection to move below the daily EMA 200 as you can see on my daily chart below and closed above 1.2915 key resistance. Overall I remain neutral but the bias is bullish in nearest term testing 1.3000 – 1.3030 resistance area. Immediate support is seen around 1.2870 (daily EMA 200). A clear break below that area could lead price to neutral zone in nearest term as direction would become unclear.
USDJPY
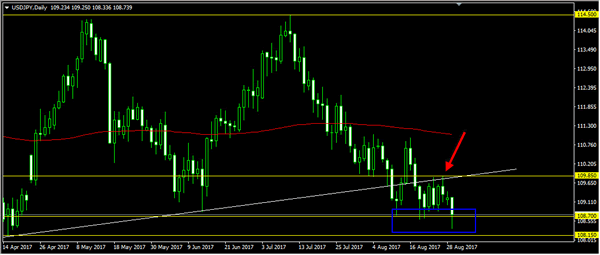
The USDJPY was indecisive yesterday. Price attempted to push lower earlier today in Asian session, slipped below 108.70 key support, hit 108.33 but traded higher and struggling around 108.70 at the time I wrote this comment. Overall I still prefer a bearish scenario but need a clear break and daily close below 108.70 to confirm the bearish continuation scenario testing 108.00 – 107.50 area as nearest bearish target. Immediate resistance is seen around 109.25 (current high). A clear break and daily close back above that area could trigger further bullish pressure retesting 109.85 key resistance.
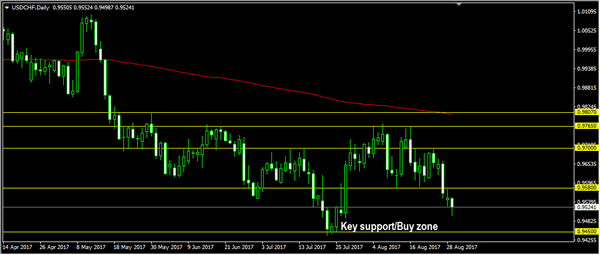
USDCHF
The USDCHF was indecisive yesterday but overall still able to maintain its bearish bias and hit 0.9498 earlier today in Asian session. The bias remains bearish in nearest term testing 0.9450 key support which remains a good place to buy with a tight stop loss. Immediate resistance is seen around 0.9580. A clear break and daily close above that area could trigger further bullish pressure testing 0.9650 – 0.9700 region. On the downside, a clear break and daily close below 0.9450 would expose 0.9350 – 0.9250 region.