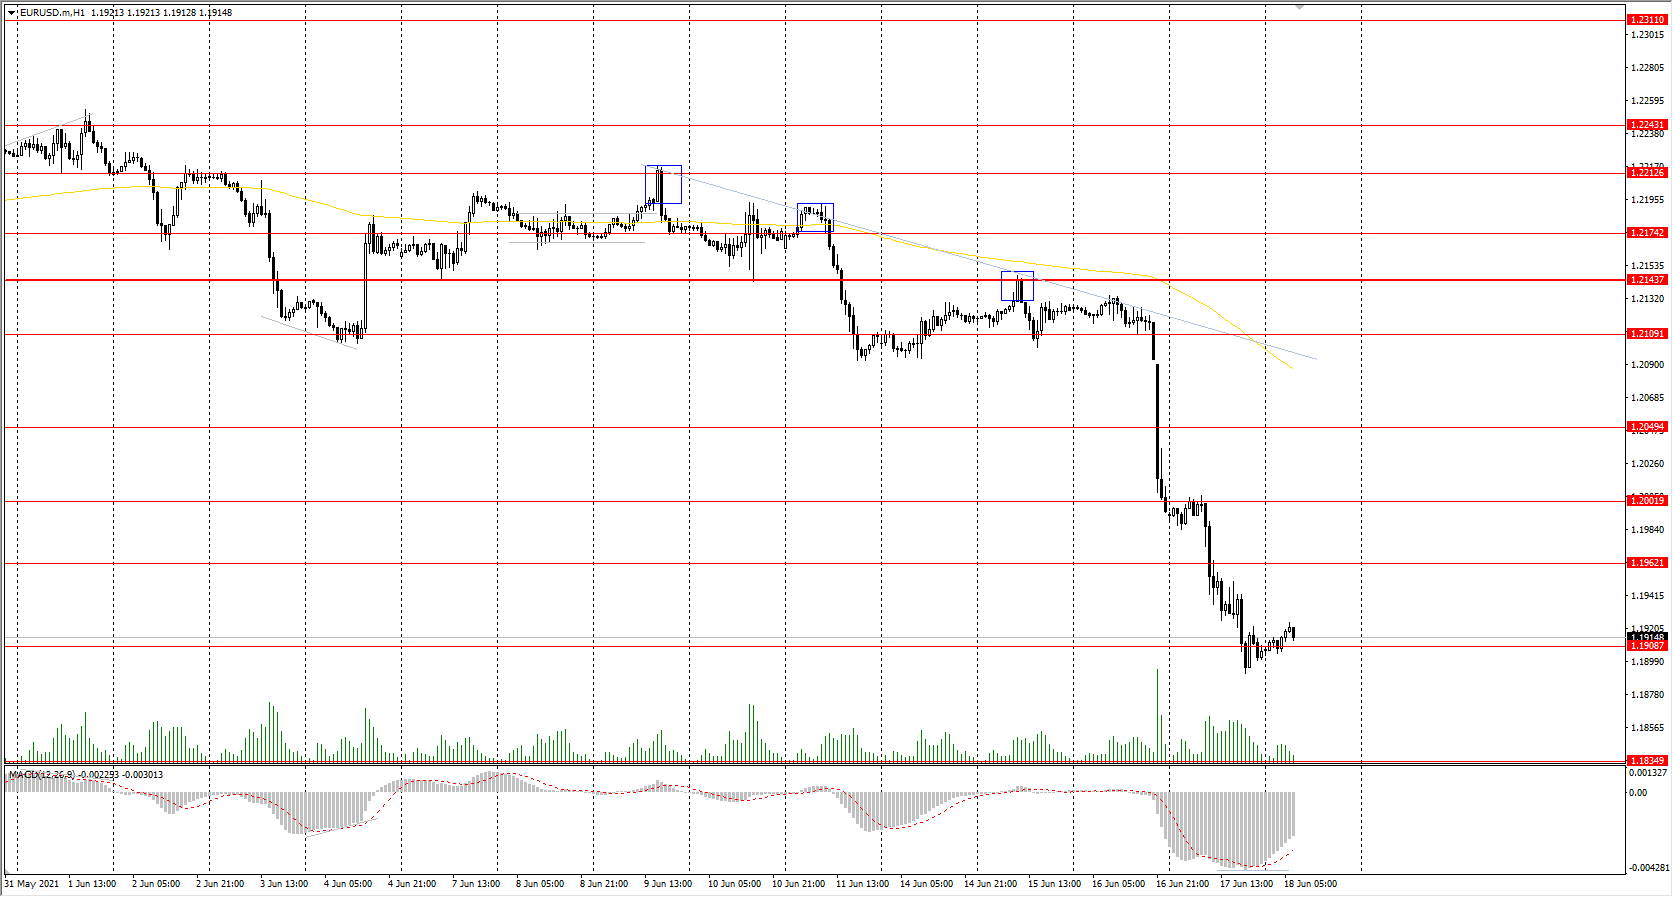
The EUR/USD currency pair
Technical indicators of the currency pair:
Prev Open: 1.1993
Prev Close: 1.1905
% chg. over the last day: -0.74%
The EUR/USD currency pair decreased by 0.74% due the rise of the dollar index. Buyers’ reaction is very weak, but now the price has approached the global support of the higher timeframe, and the vertical volumes have decreased, indicating that the sellers are not so active anymore.
Trading recommendations
Support levels: 1.1908, 1.1835, 1.1809
Resistance levels: 1.1962, 1.2002, 1.2050, 1.2109, 1.2144, 1.2174, 1.2212, 1.2243
The sellers’ pressure is still higher than the buyers’. But the MACD indicator has started signaling a divergence. The best strategy for traders is to look for the sell trades from resistance levels. But considering the strong deviation from the middle line and the presence of support levels of a higher timeframe, it is possible to look for buy deals. But it is better to look for entry points on the intraday interval and with short targets.
Alternative scenario: if the price breaks through the 1.2144 resistance level and fixes above, the general uptrend is likely to resume.
The GBP/USD currency pair
Technical indicators of the currency pair:
Prev Open: 1.3981
Prev Close: 1.3923
% chg. over the last day: -0.48%
The GBP/USD currency pair decreased by 0.42% on Thursday. The situation is very similar to the one with the euro, with the difference that the British pound reached a strong daily support level of 1.3914. Taking into account the reduction of volume, there is a good chance of a corrective upside bounce.
Trading recommendations
Support levels: 1.3914, 1.3835, 1.3801
Resistance levels: 1.4002, 1.4075, 1.4100, 1.4138, 1.4191
The trend on the GBP/USD currency pair is bearish on the H1 timeframe. At the moment, the price is trading below the moving average. The MACD indicator is oversold, but there are first signs of divergence. Under such market conditions, traders are better to look for the sell trades from resistance levels. Considering the strong deviation from the moving average, traders can also look for the buy trades from the support level of 1.3914 on the intraday timeframes.
Alternative scenario: if the price breaks through the 1.4138 resistance level and consolidates above, the bearish scenario is likely to be canceled.

News feed for 2021.06.18:
- UK Retail Sales (m/m) at 09:00 (GMT+3).
The USD/JPY currency pair
Technical indicators of the currency pair:
Prev Open: 110.63
Prev Close: 110.23
% chg. over the last day: -0.36%
The USD/JPY currency pair slightly corrected yesterday due to the strengthening of the Japanese Yen. The resistance level of 110.73 remained for the sellers. Tonight, the Bank of Japan reported on monetary policy. Inflation in Japan has entered a positive zone for the first time in 14 months, but since the inflation target forecast does not exceed 2%, no changes in the monetary policy are planned.
Trading recommendations
Support levels: 110.08, 109.83, 109.62, 109.31
Resistance levels: 110.31, 110.73 110.94, 111.48
The trend is bullish as the price is above the priority change level of 109.83. Now the price has reached the support level. Also, there is a local uptrend line in this zone. Traders are better to look for the buy trades from support levels after finishing the correction.
Alternative scenario: if the price falls below 109.83, the general downtrend is likely to resume.

News feed for 2021.06.18:
- Japan National Consumer Price Index (m/m, y/y) at 02:30 (GMT+3);
- Japan BOJ Monetary Policy Statement at 02:30 (GMT+3);
- Japan BOJ Press Conference at 09:30 (GMT+3).
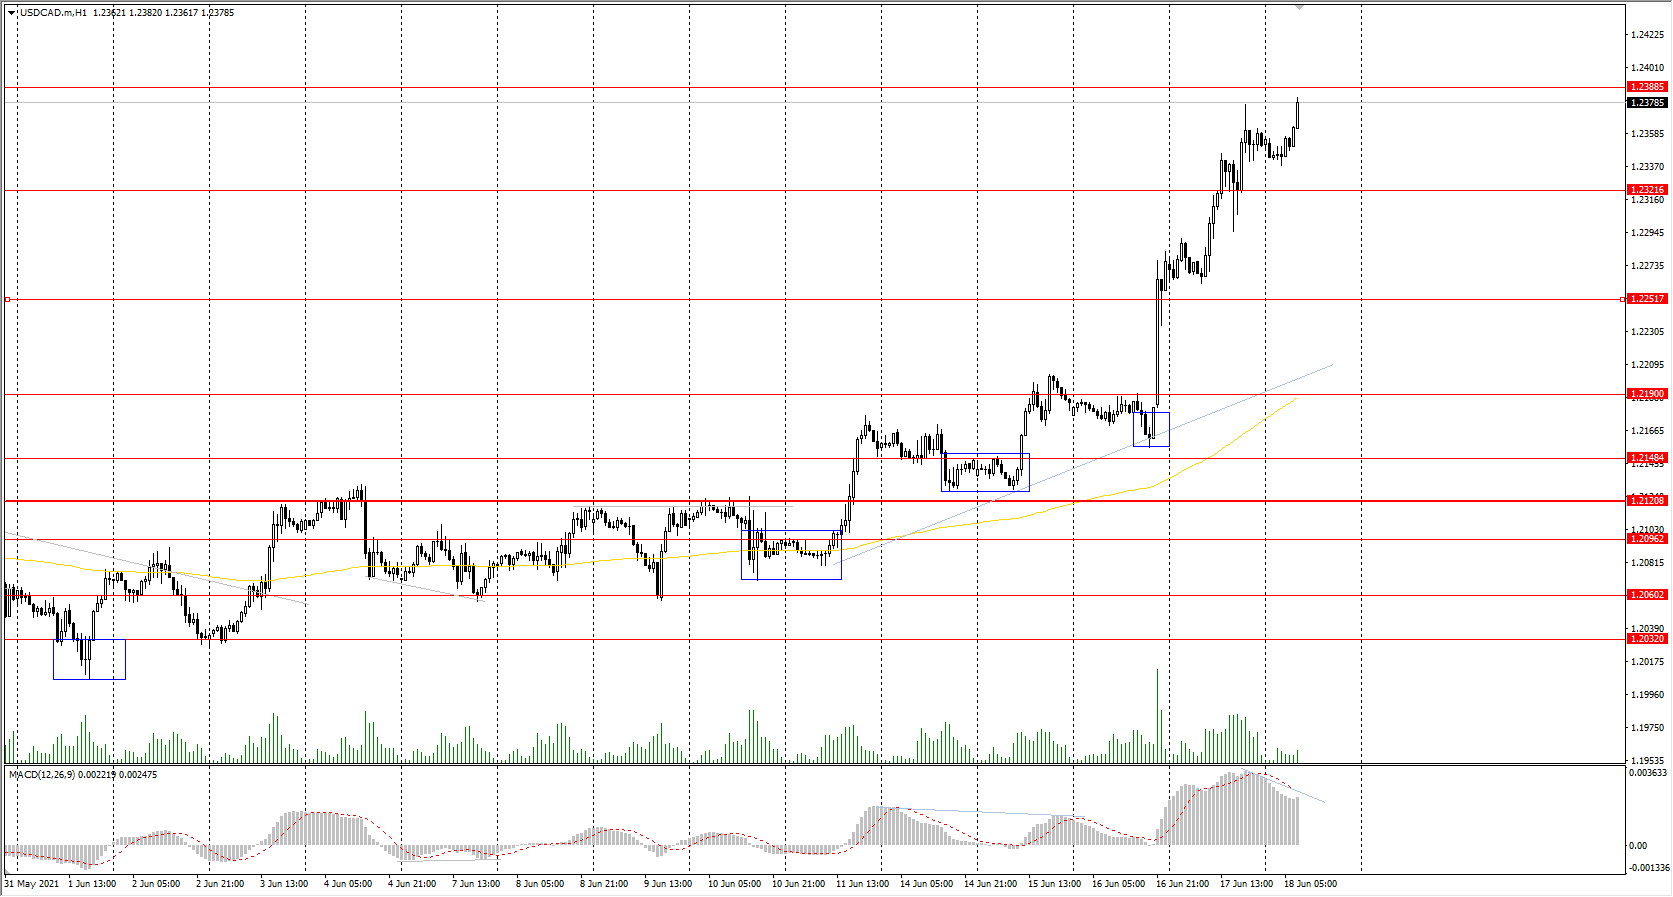
The USD/CAD currency pair
Technical indicators of the currency pair:
Prev Open: 1.2274
Prev Close: 1.2351
% chg. over the last day: +0.63%
The USD/CAD currency pair is still growing without significant corrections. On Thursday, the price increased by 0.63% and is now approaching the resistance level of the higher timeframe.
Trading recommendations
Support levels: 1.2321, 1.2251, 1.2190, 1,2148 1.2121, 1.2096
Resistance levels: 1.2388, 1.2519
Technically, the trend remains bullish. The price is trading above the moving average. The MACD indicator is in the overbought zone. There are the first signs of starting the correction move in the form of divergence. Now the buyers should wait for the price to decrease. It is possible to look for sell positions from resistance level on the lower timeframes, but trading against the trend is not recommended.
Alternative scenario: if the price breaks down through the 1.2121 support level and fixes below, the downtrend is likely to be resumed.