
We’re going to take a quick look at the Elliott Wave charts of NZDJPY, published in members area of the website. We’ve been calling rally in the Forex Pair due to impulsive bullish sequences. We recommended members to avoid selling in any proposed pull back and keep buying the dips in 3,7,11 swings. Recently NZDJPY made pull back that has unfolded as Elliott Wave Zig Zag pattern. In the further text we are going to explain the Elliott Wave Pattern and Trading Setup.
Before we take a look at the real market example, let’s explain Elliott Wave Zigzag.
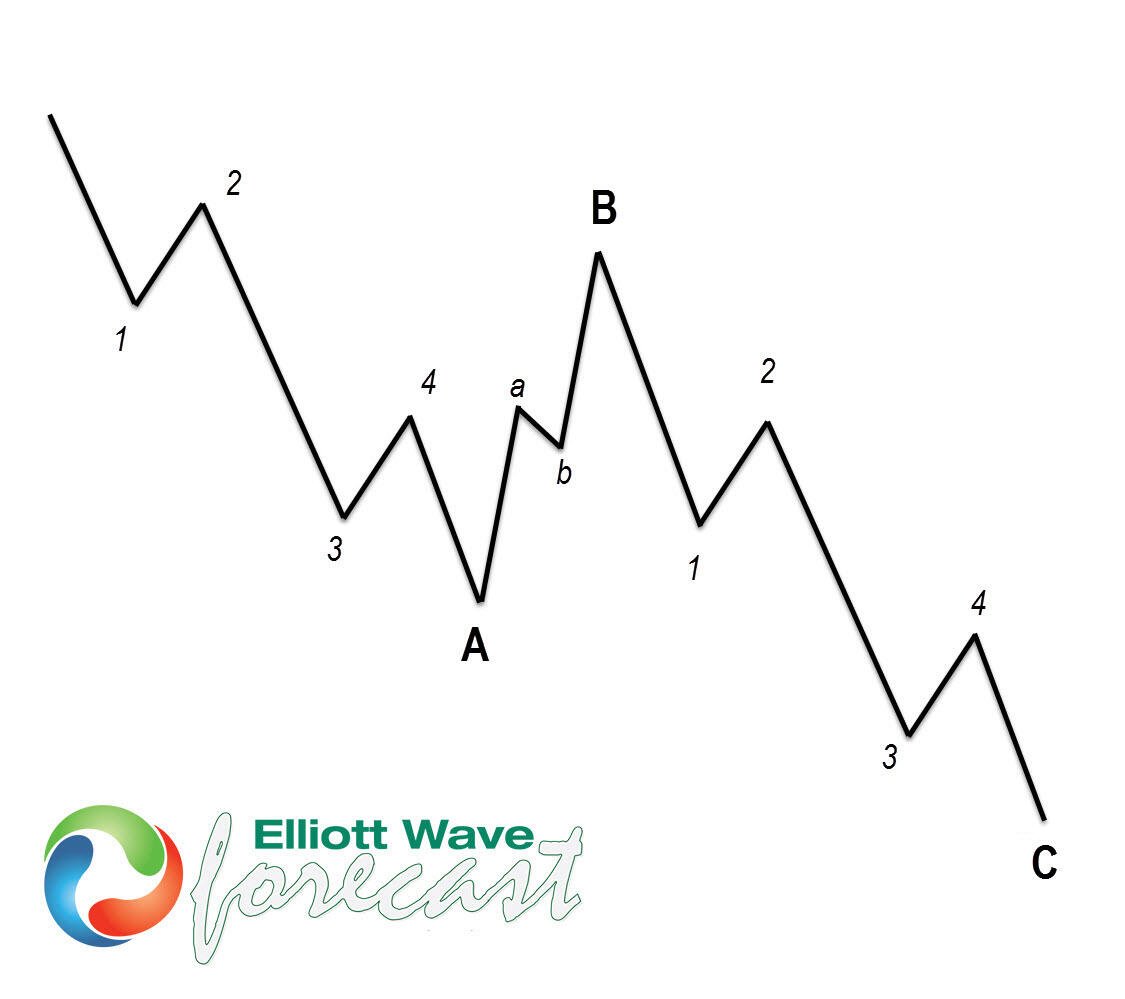
Elliott Wave Zigzag is the most popular corrective pattern in Elliott Wave theory. It’s made of 3 swings which have 5-3-5 inner structure. Inner swings are labeled as A,B,C where A =5 waves, B=3 waves and C=5 waves. That means A and C can be either impulsive waves or diagonals. (Leading Diagonal in case of wave A or Ending in case of wave C) . Waves A and C must meet all conditions of being 5 wave structure, such as: having RSI divergency between wave subdivisions, ideal Fibonacci extensions and ideal retracements.
Now let’s take a look what Elliott Wave Zig Zag looks like in real market example.
NZD/JPY Elliott Wave 4 Hour chart 6.20.2021
Right side remains in the favor of the NZDJPY. Current view suggests ((4)) black correction is unfolding as Elliott Wave Zig Zag . Inner labeling of the pattern is (A)(B)(C) blue.
At the chart below, we can see that wave (A) shows 5 waves. We got shallow (B) correction and currently (C) red leg is in progress, unfolding as 5 waves. The pair has already reached extremes at 76.7-75.38 area. Although we see potentially more short term weakness, we don’t recommend selling the pair. We like the long side from the blue box, looking for further rally toward new highs ideally. As the main trend is bullish, we should get 3 wave bounce at least from the Blue Box buyers zone. Invalidation level for the trade would be break below 1.6148 fib extension (75.38). 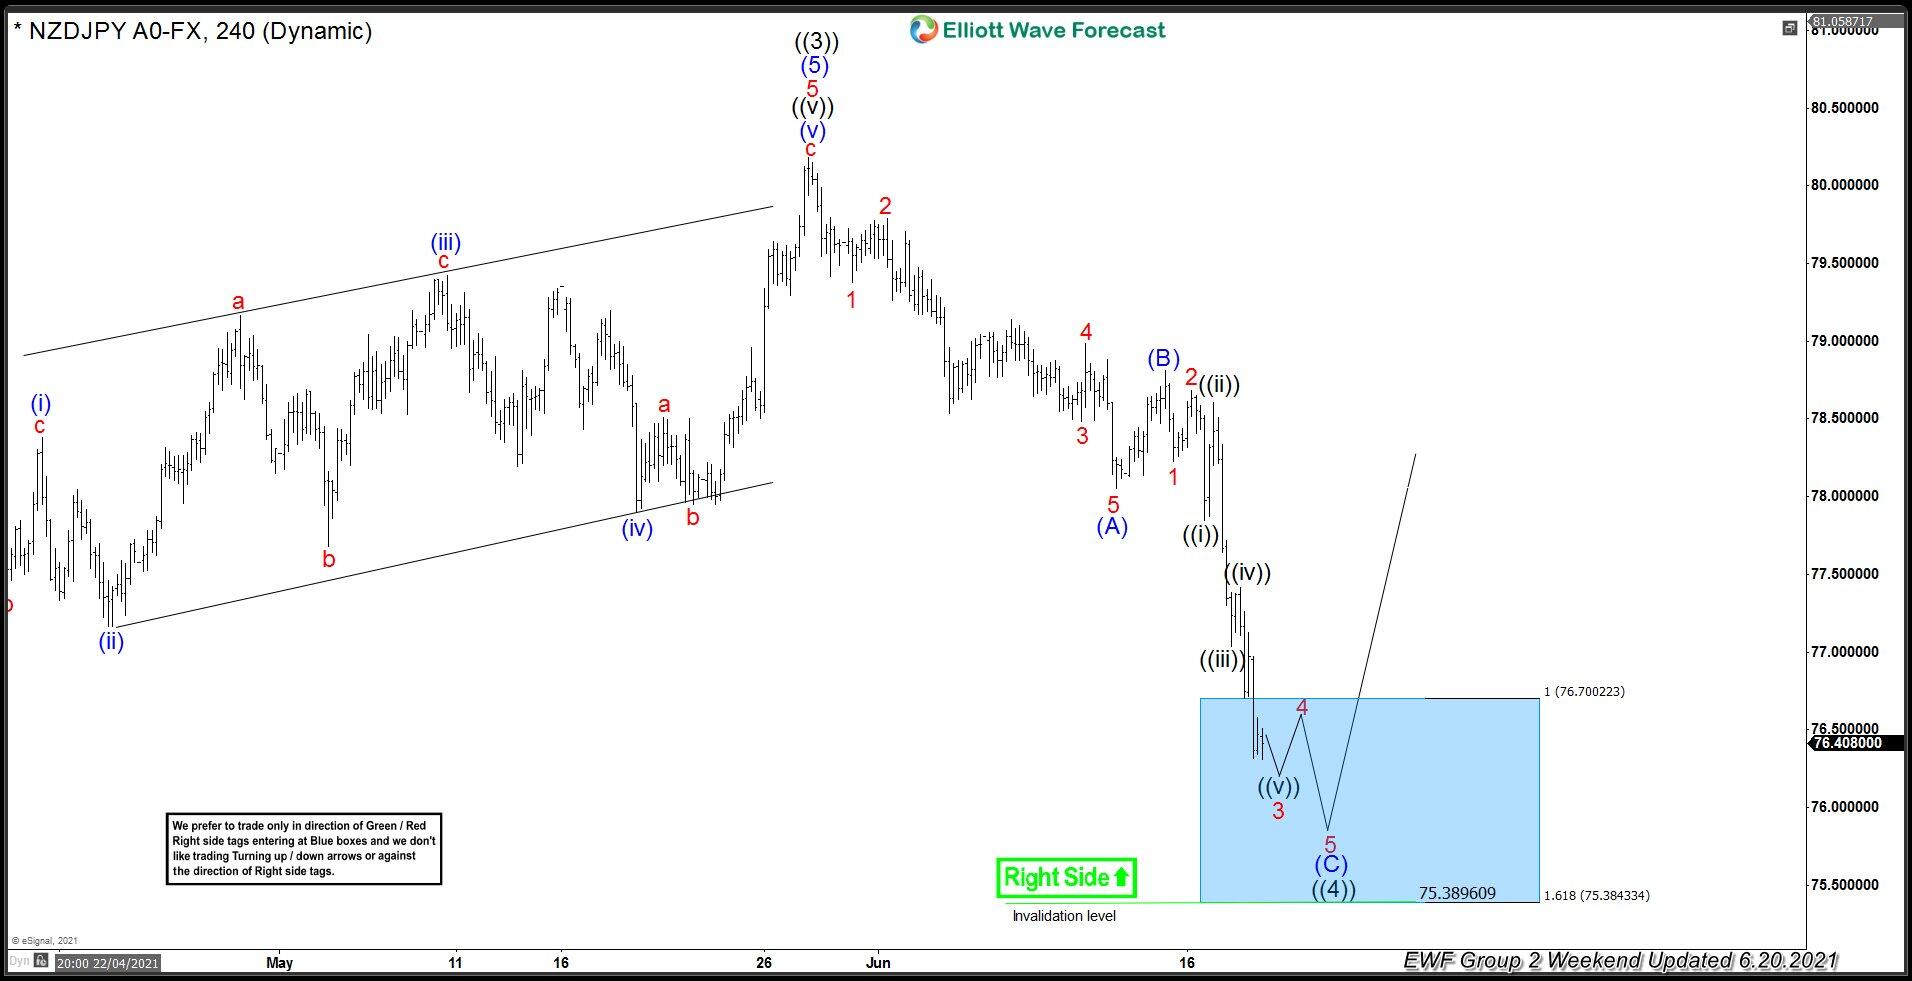
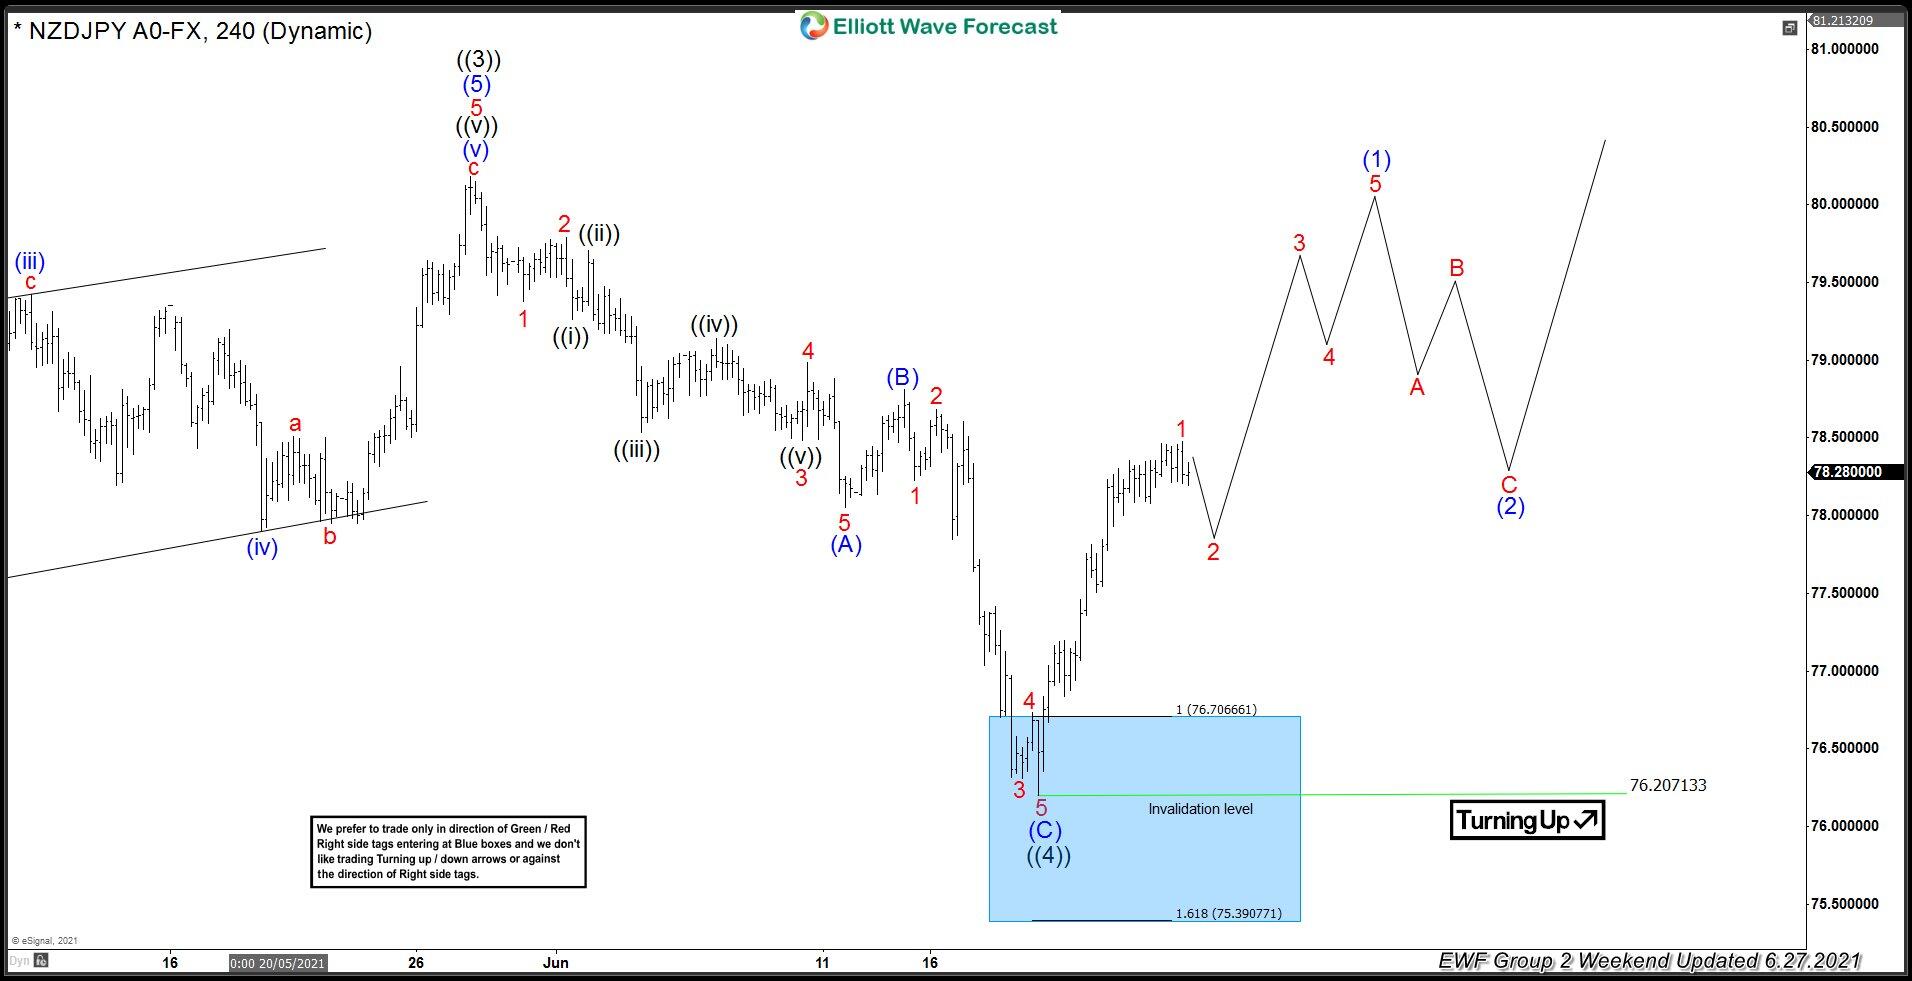
NZD/JPY Elliott Wave 4 Hour chart 6.27.2021
NZDJPY completed 5 waves in (C) leg. Buyers appeared at the blue box and we are getting good reaction from there. We believe pull back is completed at 76.2 low. As the bounce has reached and exceeded 50 fibs against the (B) high, long positions from the blue box are Risk Free. As our members know, Blue Boxes are no enemy areas , giving us 85% chance to get a bounce.


