The EUR/USD currency pair
Technical indicators of the currency pair:
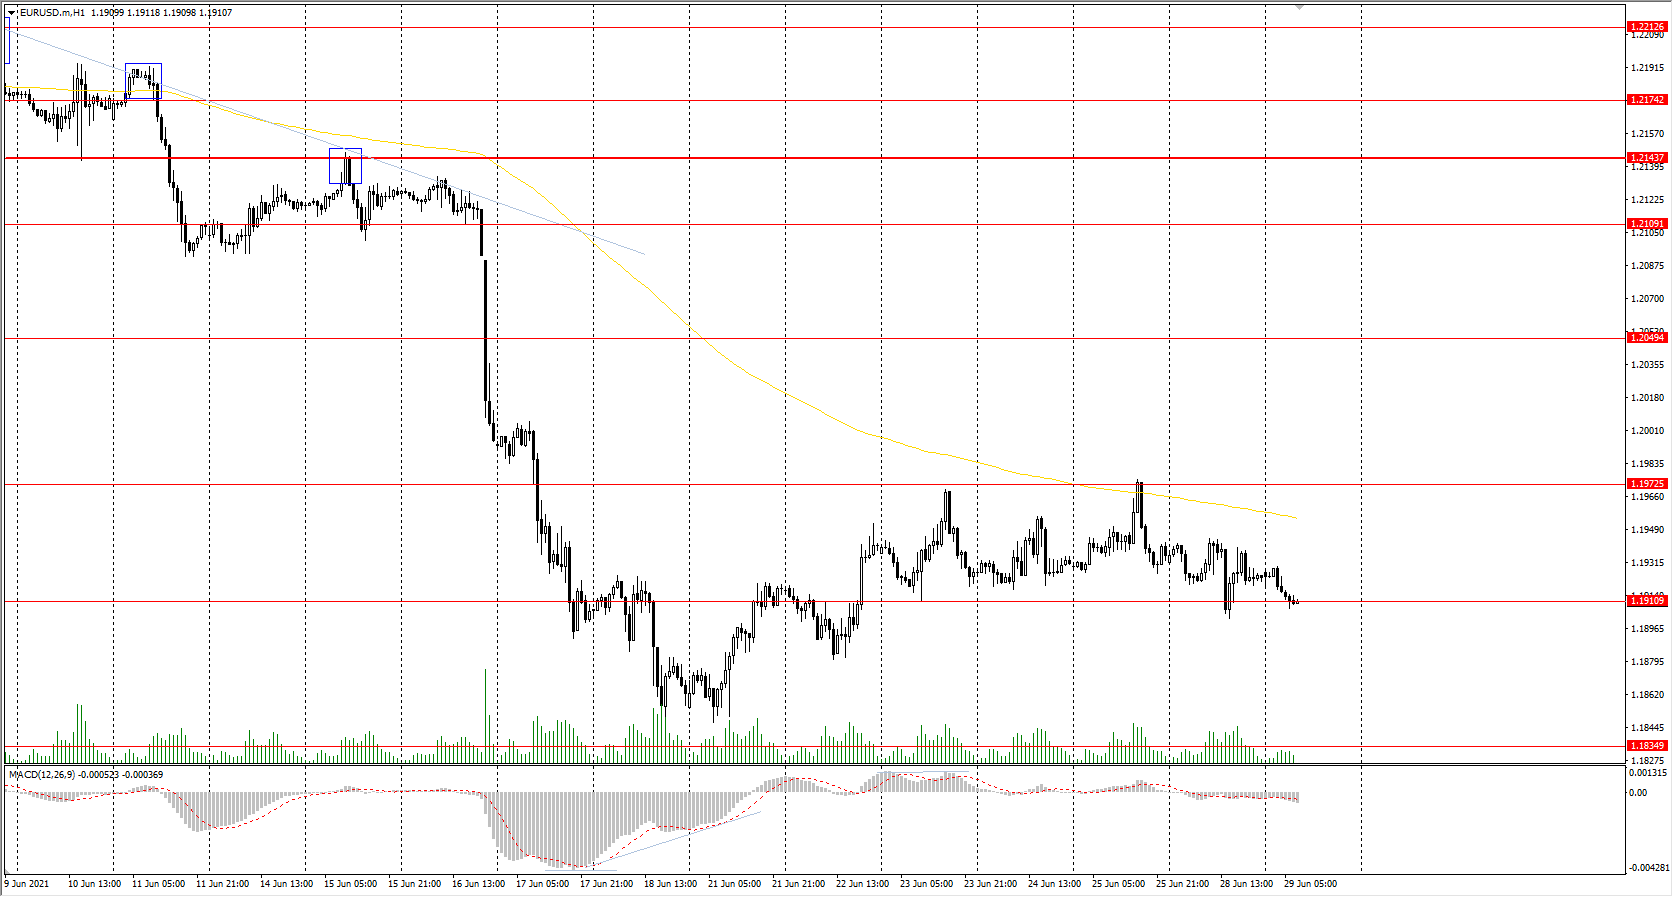
Prev Open: 1.1931
Prev Close: 1.1924
% chg. over the last day: -0.06%
The EUR/USD currency pair situation is now becoming mixed, with a slight advantage in favor of a stronger euro. The ECB printed more euro, increasing the money supply (liquidity) in the EU countries, which is a negative factor for the euro. On the other hand, the dollar index is still in the same place. As a result, the EUR/USD currency pair is consolidating in a range.
Trading recommendations
Support levels: 1.1911, 1.1835, 1.1809
Resistance levels: 1.1973, 1.2002, 1.2050, 1.2109, 1.2144, 1.2174, 1.2212
The price is trading above the level of 1.1911 but below the moving average line. The MACD indicator is inactive. The trend is still bearish, but sellers’ pressure is weak. Under such market conditions, traders can look for both sell trades from resistance levels and buy trades from support levels with short targets.
Alternative scenario: if the price breaks out through the 1.2144 resistance level and fixes above, the general uptrend is likely to resume.
News feed for 2021.06.29:
- ECB President Christine Lagarde Speaks at 16:40 (GMT+3);
- US CB Consumer Confidence (m/m) at 17:00 (GMT+3).
The GBP/USD currency pair
Technical indicators of the currency pair:
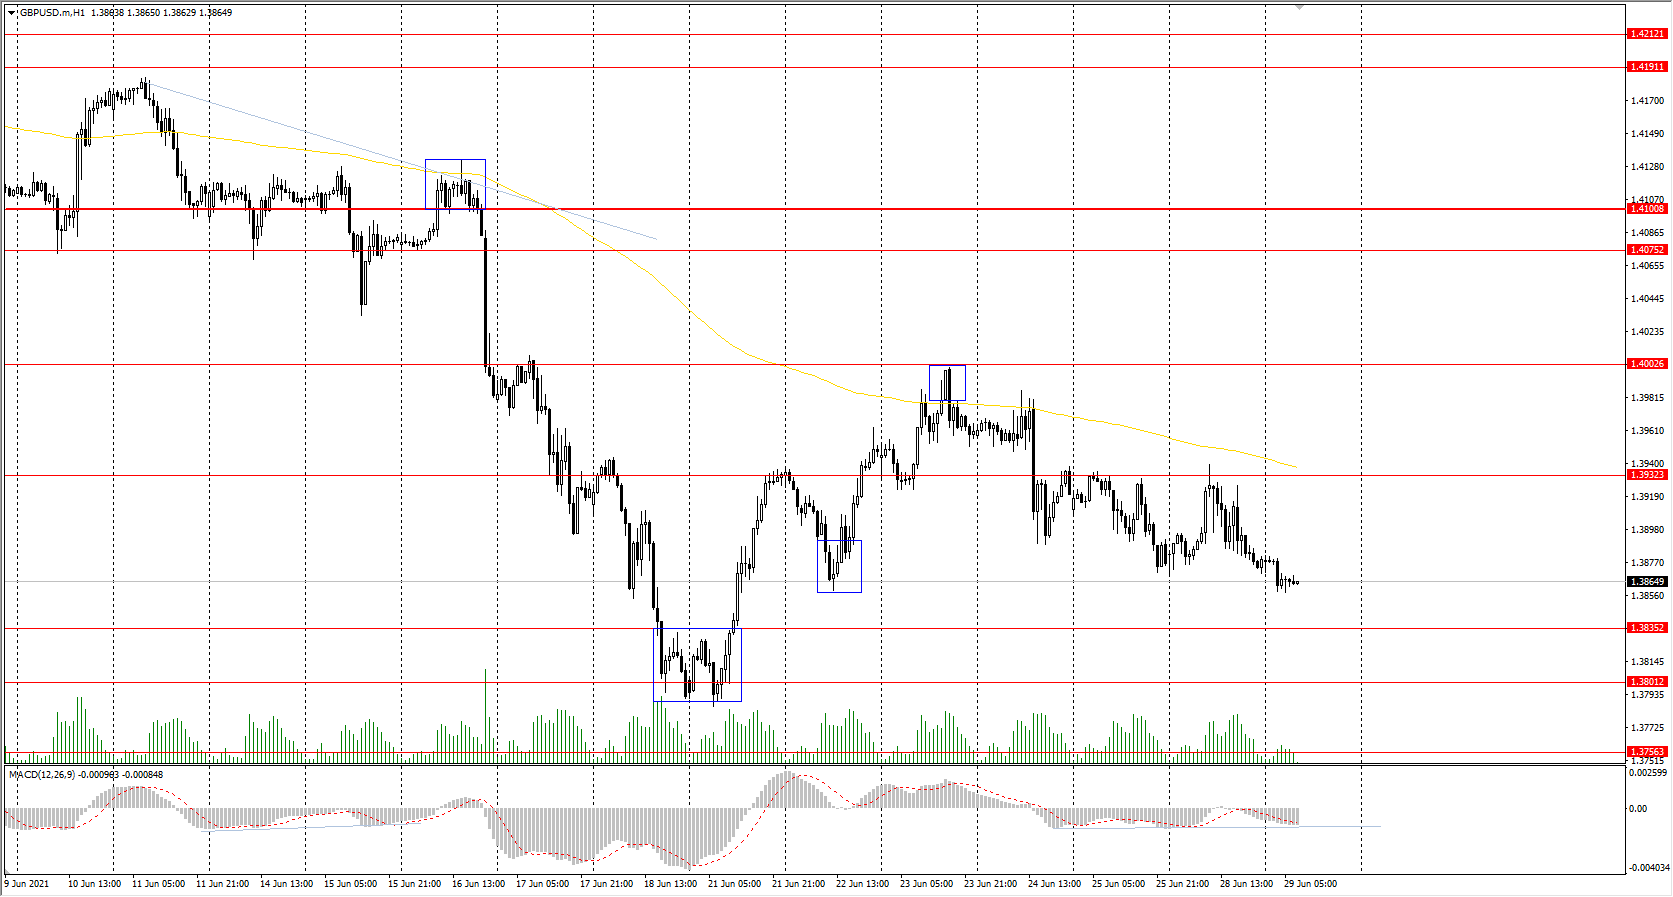
Prev Open: 1.3911
Prev Close: 1.3877
% chg. over the last day: -0.24%
The GBP/USD currency pair continues to decline slowly. Coronavirus restrictions in the United Kingdom are still holding back business activity in various sectors of the economy. Given that the dollar index remains unchanged, the situation is not in favor of the British pound. However, the UK Prime Minister Boris Johnson remains confident that the country would be able to fully re-open in July as planned.
Trading recommendations
Support levels: 1.3835, 1.3801, 1.3767
Resistance levels: 1.3931, 1.4002, 1.4075, 1.4101, 1.4138, 1.4191
The GBP/USD trend is bearish on the H1 timeframe. The price is trading near the moving average, while the MACD indicator is in the negative zone but with signs of a reversal. Under such market conditions, traders are better to look for both sell trades from the resistance levels and buy trades from the support levels on the intraday timeframes.
Alternative scenario: if the price breaks out through the 1.4101 resistance level and consolidates above, the bearish scenario is likely to be canceled.
The USD/JPY currency pair
Technical indicators of the currency pair:
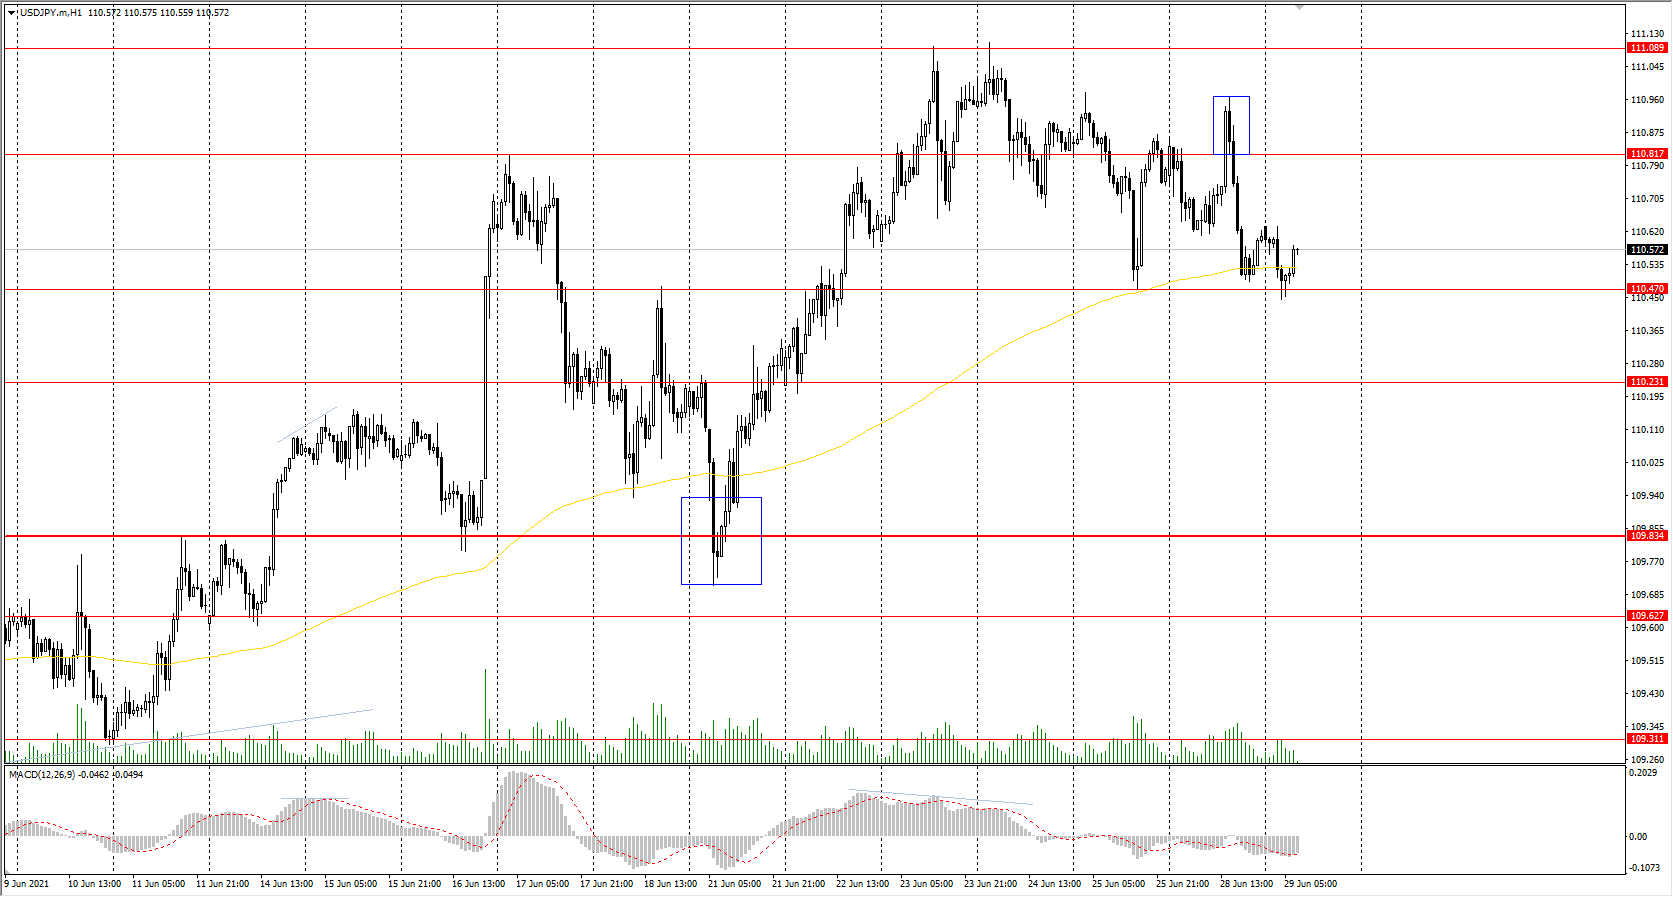
Prev Open: 110.76
Prev Close: 110.61
% chg. over the last day: -0.13%
Yesterday, the USD/JPY currency pair tried to hold above the resistance level of 110.82, but sellers returned the price to its previous level, forming a false breakout zone. As a result, the price corrected again to the moving average line and to the nearest support level, where the buyers manage to keep the pressure of sellers. Japan’s unemployment rate increased from 2.8% to 3% in May, the highest rate in the last 5 months.
Trading recommendations
Support levels: 110.47, 110.23, 109.83, 109.62, 109.31
Resistance levels: 110.82, 111.09, 111.48
The trend remains bullish. The price is trading at the level of the moving average, and the MACD indicator is in the negative zone. Under such market conditions, traders are better to look for buy trades from support levels. Sell positions can be considered on intraday timeframes after the breakdown of the 110.47 support level.
Alternative scenario: if the price falls below 109.83, the general downtrend is likely to resume.
News feed for 2021.06.29:
- Japan Unemployment Rate (m/m) at 02:30 (GMT+3).
The USD/CAD currency pair
Technical indicators of the currency pair:
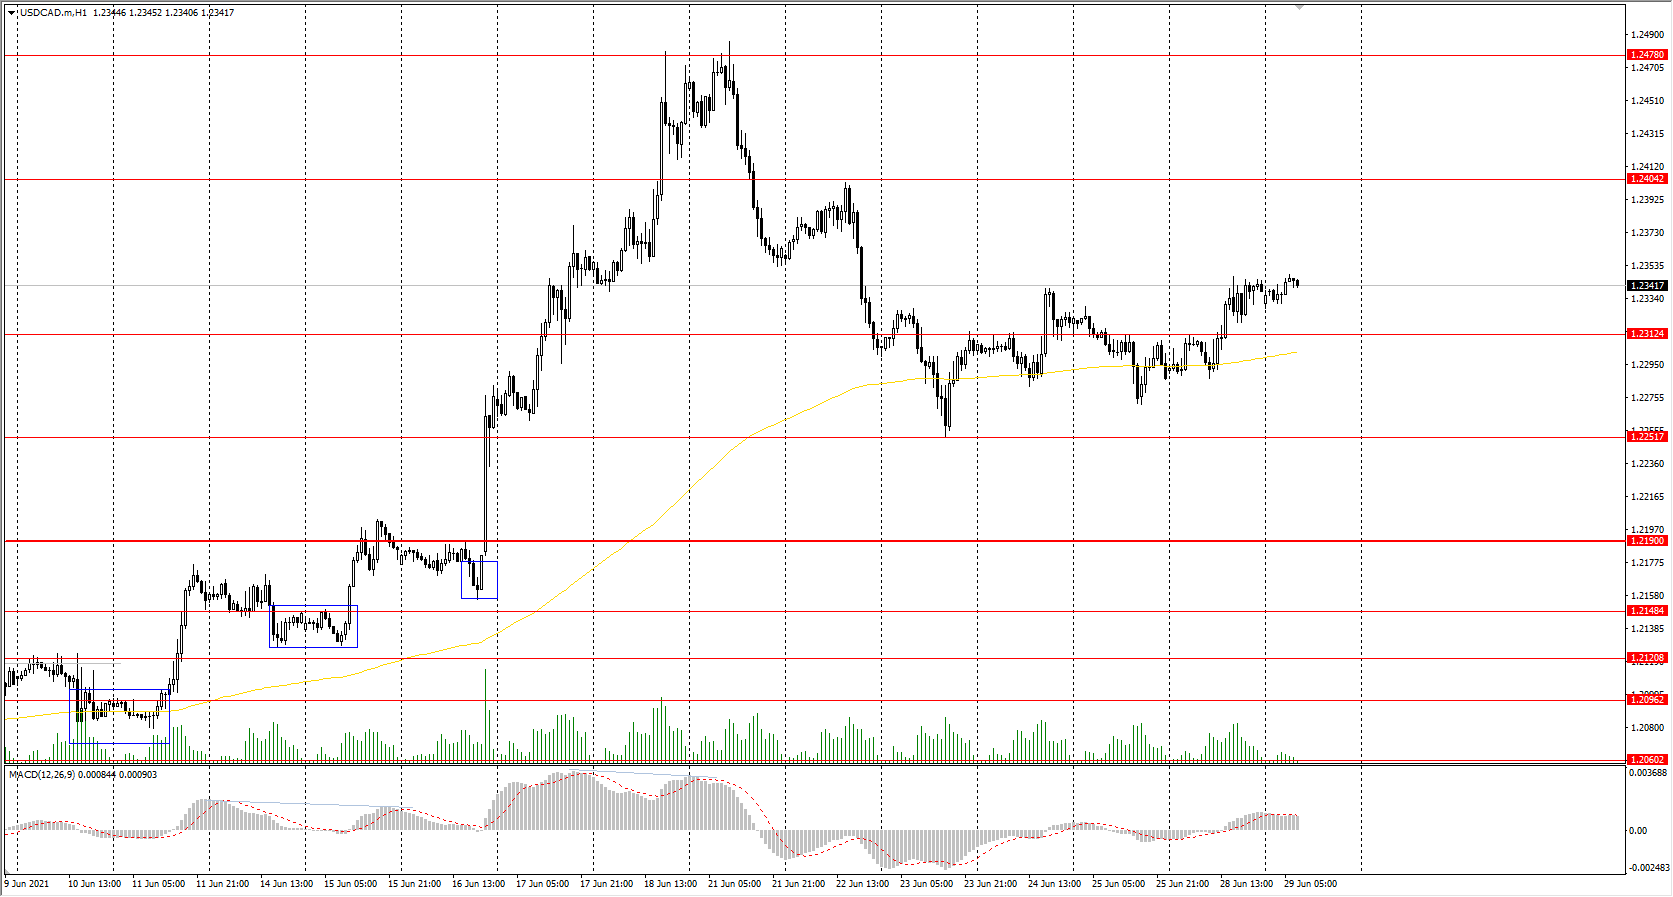
Prev Open: 1.2291
Prev Close: 1.2338
% chg. over the last day: +0.38%
The USD/CAD currency pair is still trading in a narrow price range, but there are the first signs of initiative from the buyers. The 1.2312 resistance level was broken, and now it is important not to let the price fall below this point. The fundamental background remains mixed, with a slight advantage to the strengthening of the Canadian dollar, i.e., the fall of USD/CAD quotes.
Trading recommendations
Support levels: 1.2312, 1.2251, 1.2190, 1,2148 1.2121, 1.2096
Resistance levels: 1.2404, 1.2478, 1.2519
Technically, the trend remains bullish. The price is trading above the moving average, and the MACD indicator went into the positive area. Under such market conditions, it is best to trade on the lower timeframes. Buyers may look for buy trades from support levels. There are no optimal entry points for sell trades right now.
Alternative scenario: if the price breaks down through the 1.2190 support level and fixes below, the downtrend is likely to be resumed.