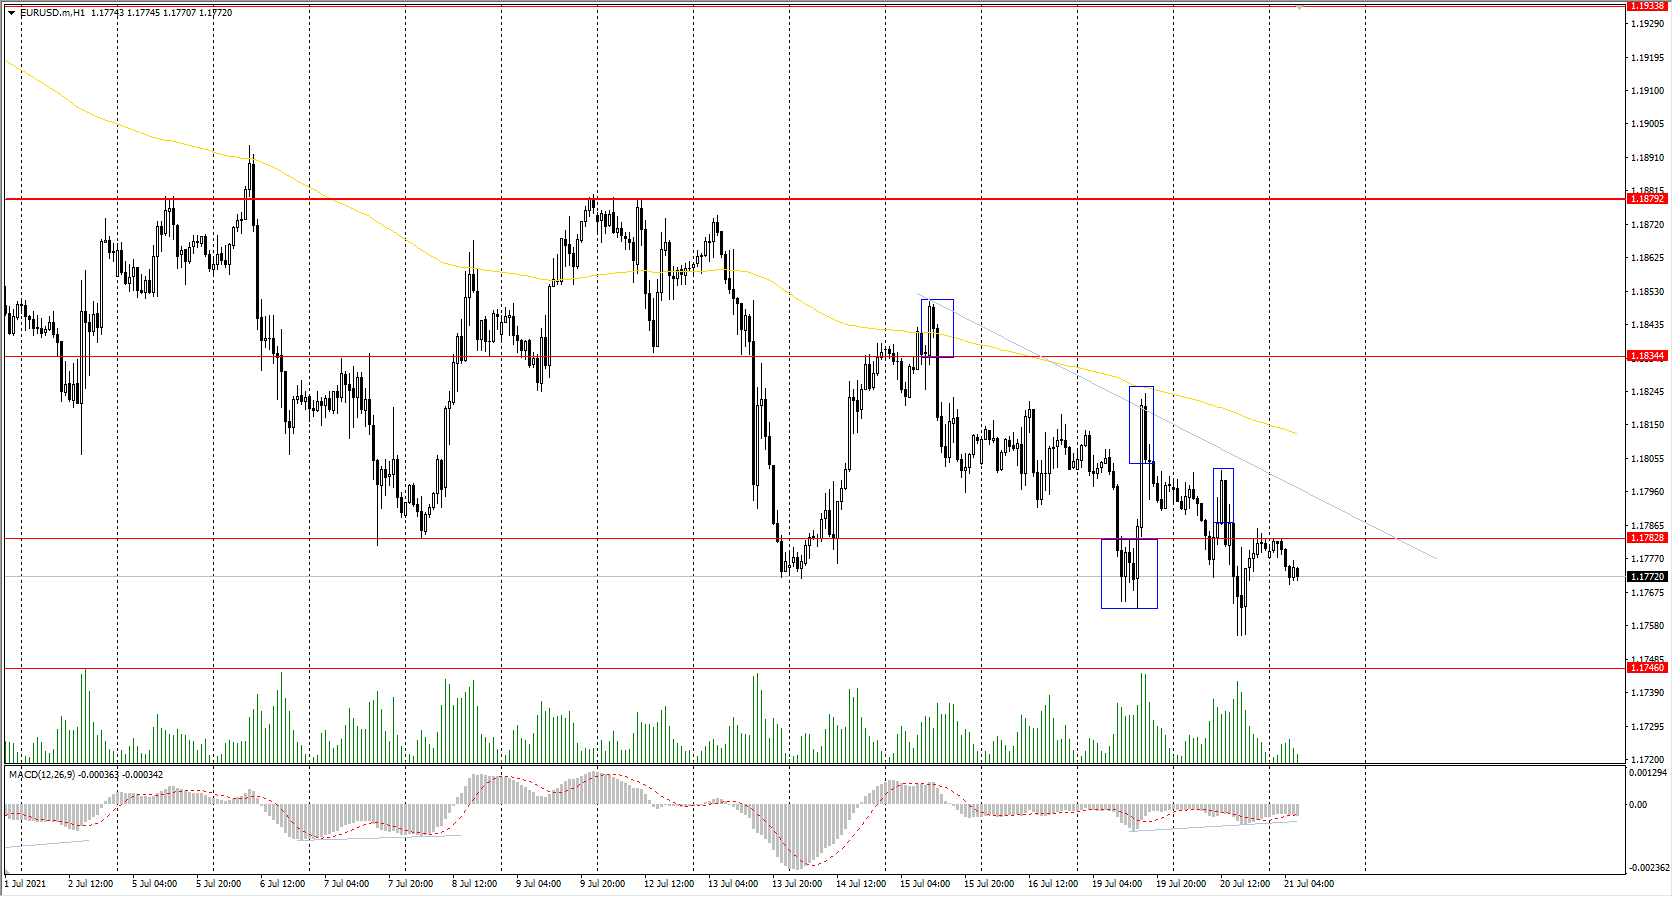
The EUR/USD currency pair
Technical indicators of the currency pair:
Prev Open: 1.1797
Prev Close: 1.1780
% chg. over the last day: -0.14%
The fundamental picture on the EUR/USD currency pair plays in favor of the growth of quotes, but the dollar index, which has an inverse correlation, is slowly growing, which has a negative impact on the euro.
Trading recommendations
Support levels: 1.1746, 1.1609
Resistance levels: 1.1783, 1.1834, 1.1879, 1.1934, 1.1969
From the technical point of view, the trend is still bearish. But it should be noted that sellers’ pressure gets weaker because each next downward break updates the price minimum very insignificantly. And that demonstrates the weakness of the sellers. On the other hand, there is no initiative from the buyers either. With a high probability, till the ECB meeting, which will take place tomorrow, the situation will remain unchanged. Under such market conditions, traders should look for intraday deals because there are no optimal entry points on the H1 timeframe right now.
Alternative scenario: if the price breaks through the 1.1879 resistance level and fixes above, the general uptrend is likely to be resumed.
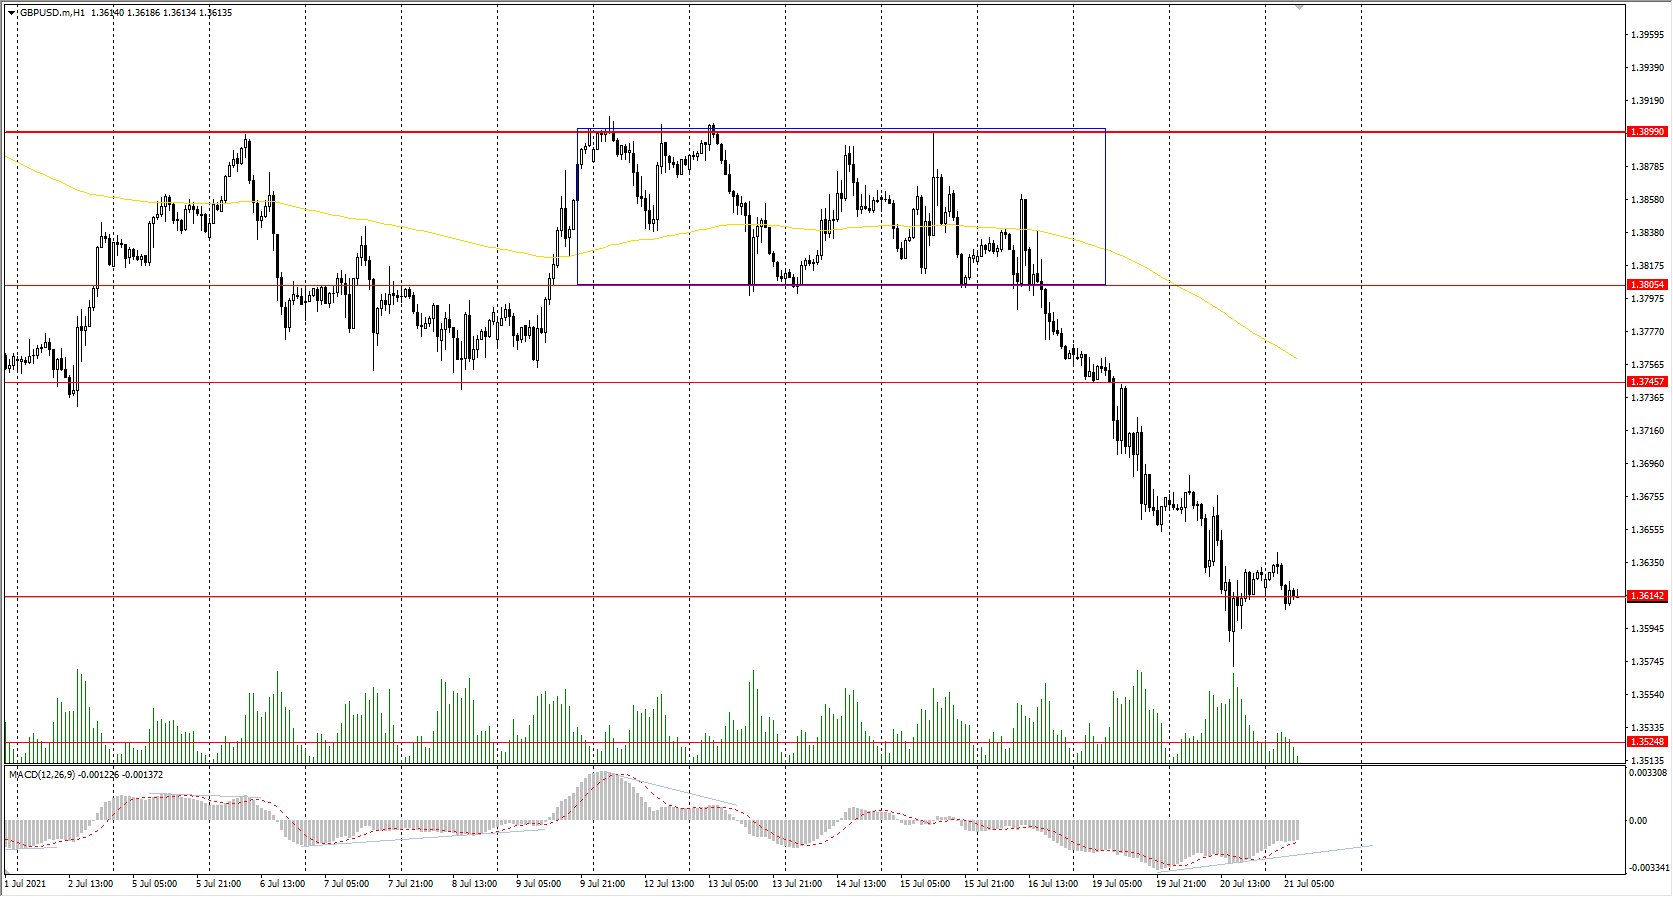
The GBP/USD currency pair
Technical indicators of the currency pair:
Prev Open: 1.3773
Prev Close: 1.3628
% chg. over the last day: -1.06%
The British pound, unlike the euro, is falling steadily. The following factors put pressure on the GBP/USD quotes: 1) falling oil prices (the UK is the largest exporter of Brent oil), 2) there is an open issue of trade relations between the UK and the European Union, 3) increase in the number of disease cases after the lifting of restrictions. On the other hand, more than 52% of the UK adult population has already been fully vaccinated, with nearly 68% receiving the first dose of vaccine. The number of deaths decreased by almost 10 times. Considering the full opening of the economy, the prospects for economic growth in the country are huge, which will undoubtedly affect the strengthening of the course.
Trading recommendations
Support levels: 1.3614, 1.3525
Resistance levels: 1.3745, 1.3805, 1.3899, 1.3923, 1.4002, 1.4075, 1.4101
On the hour timeframe, the trend on the GBP/USD currency pair is strictly downward. The MACD indicator went into the negative zone, but there is a divergence on the H1 and H4 timeframes. Under such market conditions, traders are better to look for both sell deals from the resistance levels within the trend and buy deals from the support levels, but only on the intraday timeframes and with short targets.
Alternative scenario: if the price breaks through the 1.3899 resistance level and consolidates above, the bearish scenario is likely to be canceled.
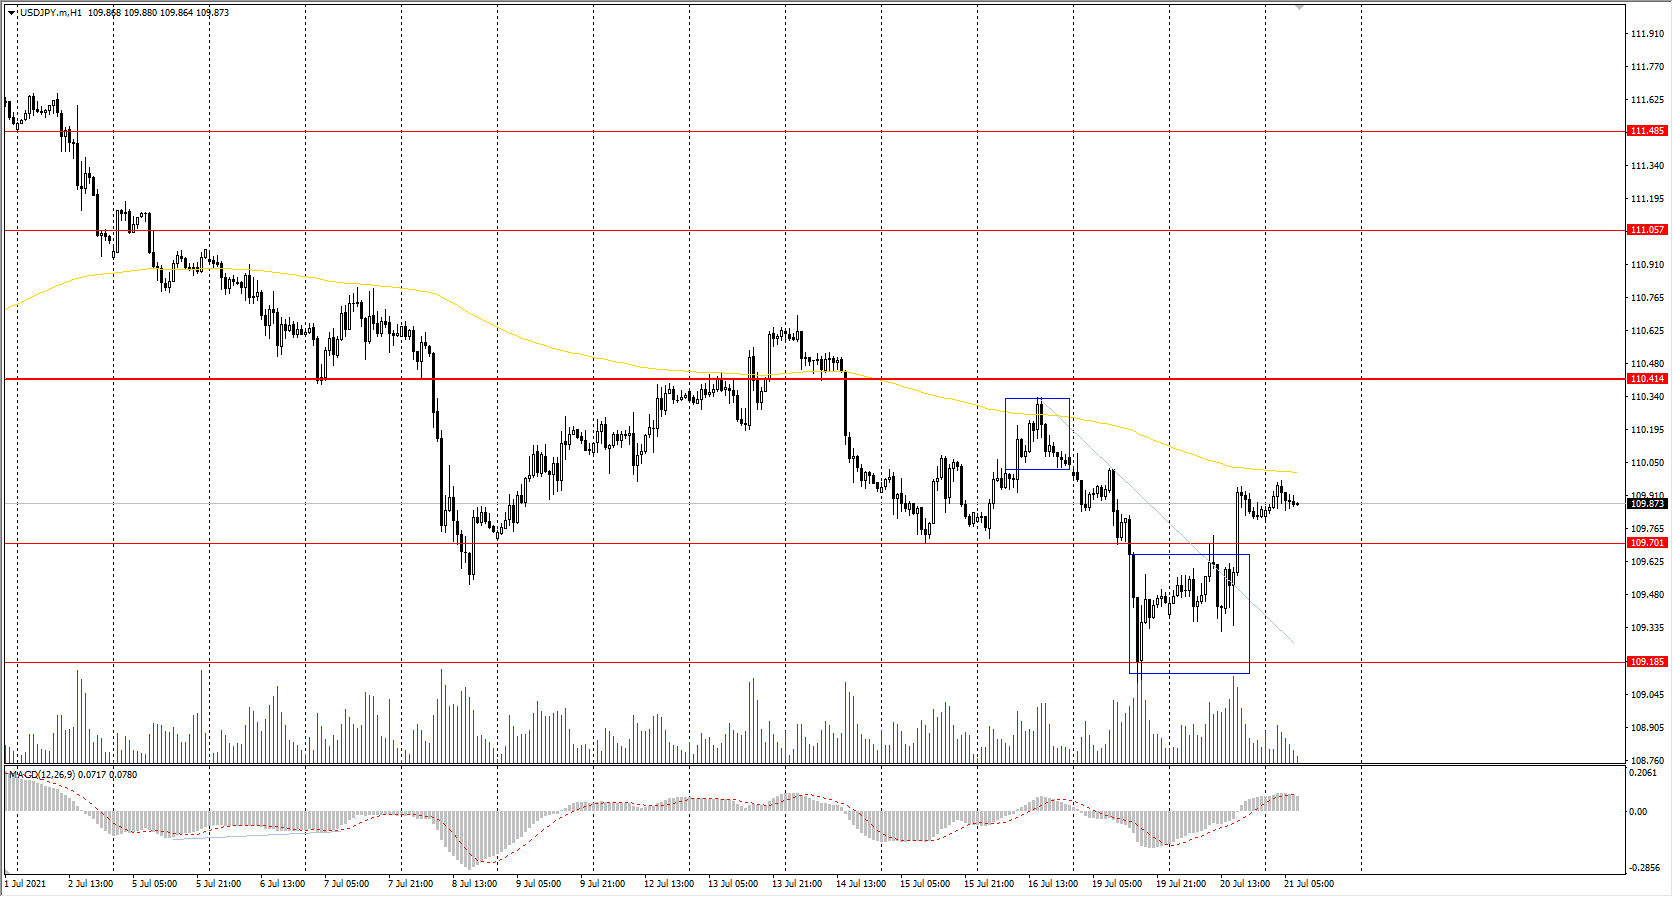
The USD/JPY currency pair
Technical indicators of the currency pair:
Prev Open: 109.39
Prev Close: 109.85
% chg. over the last day: +0.42%
The USD/JPY currency pair began to show signs of reversal. Amid a slight strengthening of Tokyo’s Nikkei 225 index, the futures on the Japanese yen slightly declined, which, together with the rise in the dollar index, led to an increase in the USD/JPY quotes. By the end of the week, the USD/JPY will correlate even more with the dollar index, as there will be a bank holiday in Japan.
Trading recommendations
Support levels: 109.70, 109.19, 108.65
Resistance levels: 110.41, 110.73, 111.06, 111.48, 110.73, 112.18
From the point of view of technical analysis, the situation has not changed. There is a downward trend on the H1 timeframe, as the price is still trading below the priority change level and the moving average. The MACD indicator has returned to the positive zone. Under such market conditions, traders should look for both selling from the resistance levels and buying from the support levels, but only with short targets.
Alternative scenario: if the price rises above 110.41, the uptrend is likely to be resumed.
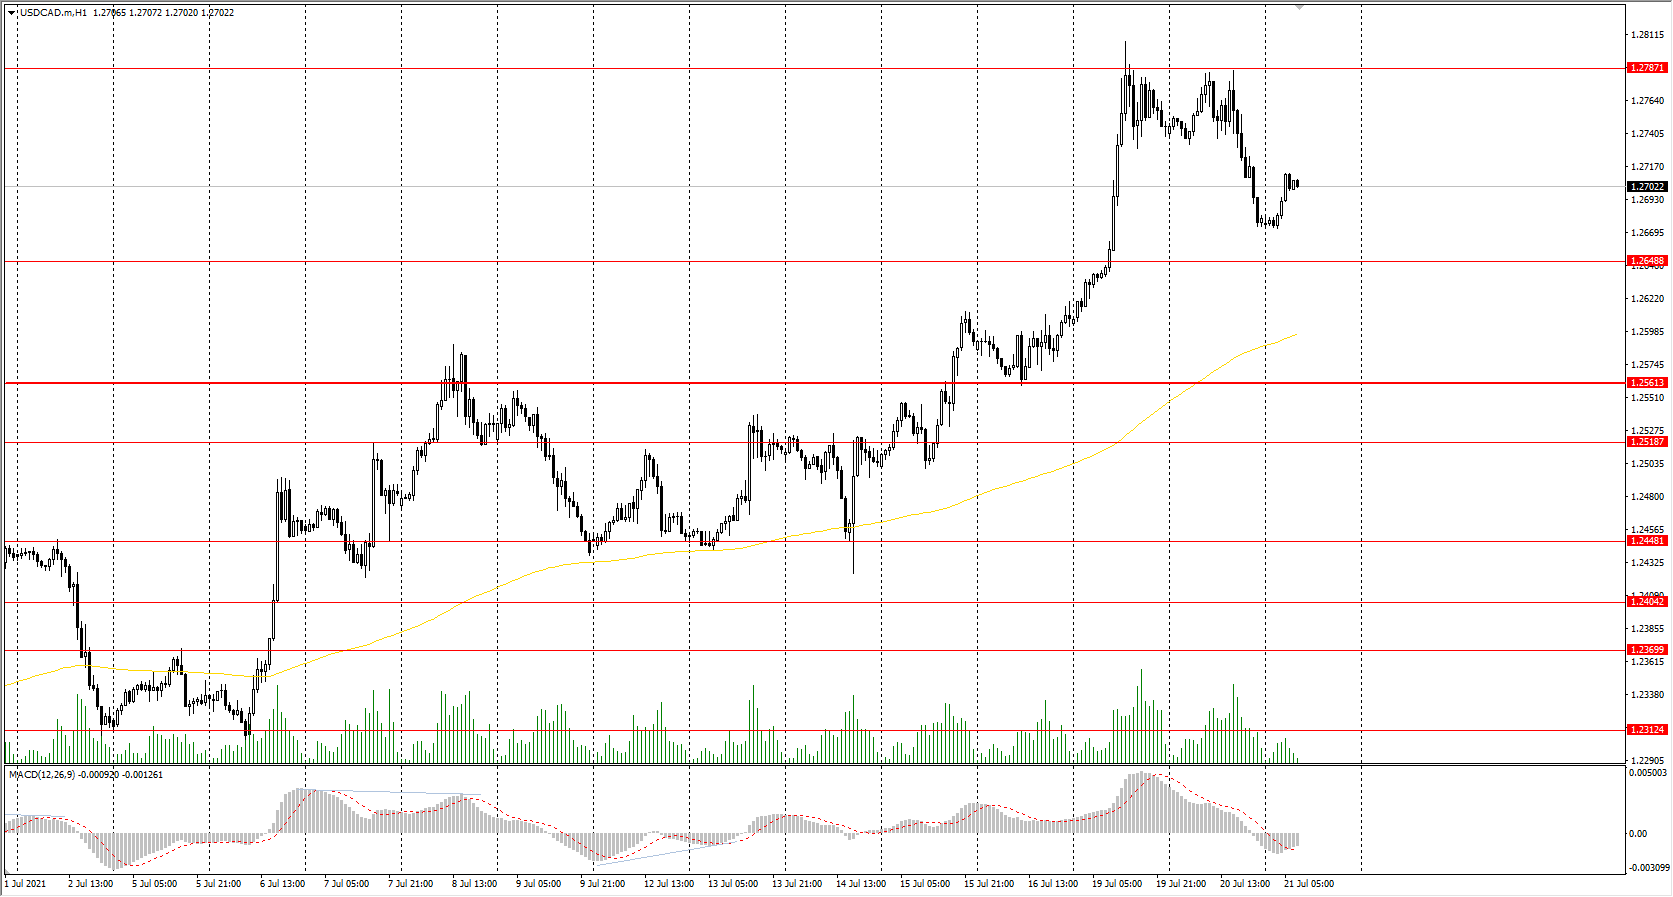
The USD/CAD currency pair
Technical indicators of the currency pair:
Prev Open: 1.2740
Prev Close: 1.2679
% chg. over the last day: -0.48%
Yesterday, the USD/CAD currency pair slightly corrected after a 4-day rally. There is a large inverse correlation observed between oil and USD/CAD, and it is not surprising since the Canadian dollar is a commodity currency. The US crude oil inventories data will be released today. An increase in oil prices will have a positive effect on the Canadian futures while the USD/CAD will decrease. Conversely, a drop in oil prices will continue the upward trend in the USD/CAD.
Trading recommendations
Support levels: 1.2649, 1.2561, 1.2519, 1.2448, 1.2404, 1.2347, 1.2312
Resistance levels: 1.2787, 1,2951
Technically, the trend remains bullish. The sellers finally showed initiative at the 1.2787 resistance level. The MACD indicator has become inactive. Under such market conditions, it is better to trade intraday. Buy positions should be looked for at the nearest support levels, but it is better to buy when there is a confirmation. There are no optimal entry points for sell positions right now.
Alternative scenario: if the price breaks through the 1.2561 support level and fixes below, the downtrend is likely to be resumed.