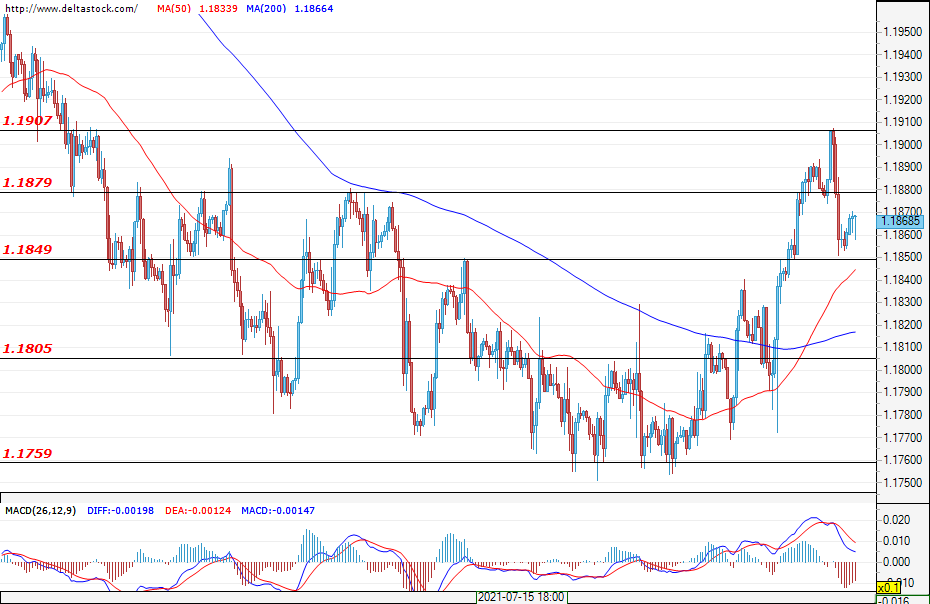
EUR/USD
Current level – 1.1868
The upward move of the single European currency against the U.S. dollar since the end of last week was limited to the resistance level at 1.1907. The subsequent depreciation can be considered as a corrective move in order to find better levels for market entry. The forecast is rather positive – for another attack on the resistance level at 1.1907. The most important economic news scheduled for this week will happen near its end, when the non-farm payrolls change data for the U.S. will be announced (Friday; 12:30 GMT), as well as the data on the unemployment rate for the U.S. (Friday; 12:30 GMT).
| Resistance | Support | ||
| intraday | intraweek | intraday | intraweek |
| 1.1880 | 1.1970 | 1.1849 | 1.1759 |
| 1.1945 | 1.2070 | 1.1805 | 1.1700 |
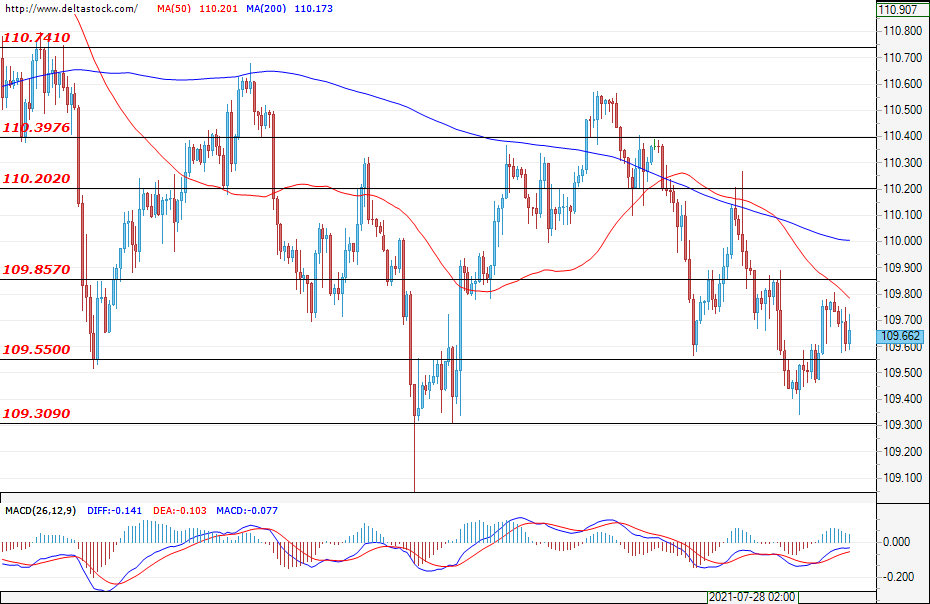
USD/JPY
Current level – 109.66
The U.S. dollar continues to lose ground against the Japanese yen after the upward move from the end of last week was limited to just below the resistance level at 109.85. A successful breach of the support at 109.55 could boost the sell-off and pave the way for the currency pair towards a test of the next significant support zone at around 109.00. A consolidation of the range movement between 109.00 – 110.75, coming from the higher time frames, is also not excluded.
| Resistance | Support | ||
| intraday | intraweek | intraday | intraweek |
| 109.85 | 110.39 | 109.55 | 108.55 |
| 110.20 | 110.70 | 109.30 | 108.10 |
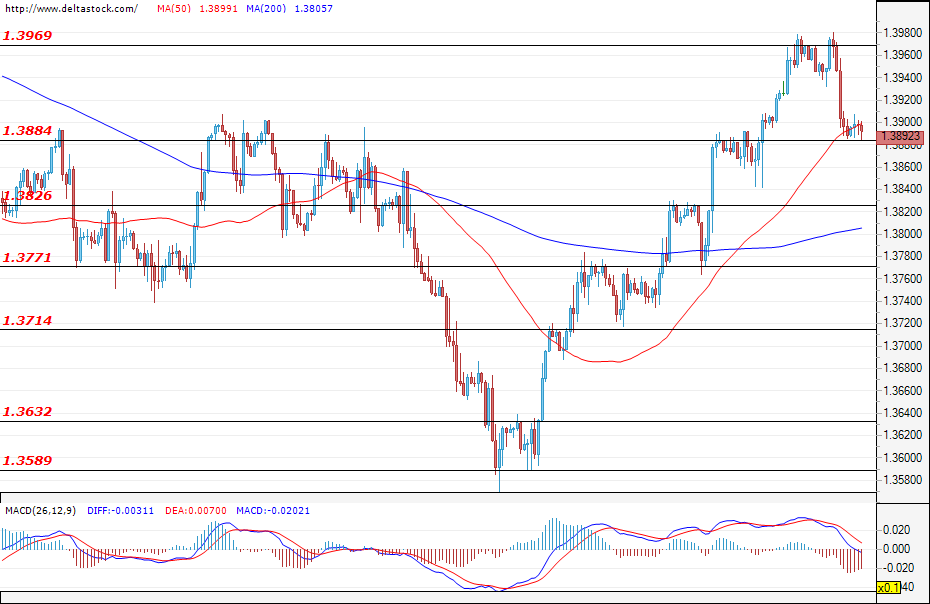
GBP/USD
Current level – 1.3892
The depreciation of the sterling against the U.S. dollar began during the last trading session of last week and, at the time of writing the analysis, the currency pair is facing a test of the support zone at 1.3884. The predictions that the bulls will be restrained by the resistance level at 1.3970 rang true and a breach of the current support zone at 1.3884 could boost the sell-off and send the currency pair towards a test of the next more significant support area at 1.3770.
| Resistance | Support | ||
| intraday | intraweek | intraday | intraweek |
| 1.3970 | 1.4060 | 1.3884 | 1.3771 |
| 1.4000 | 1.4115 | 1.3826 | 1.3630 |