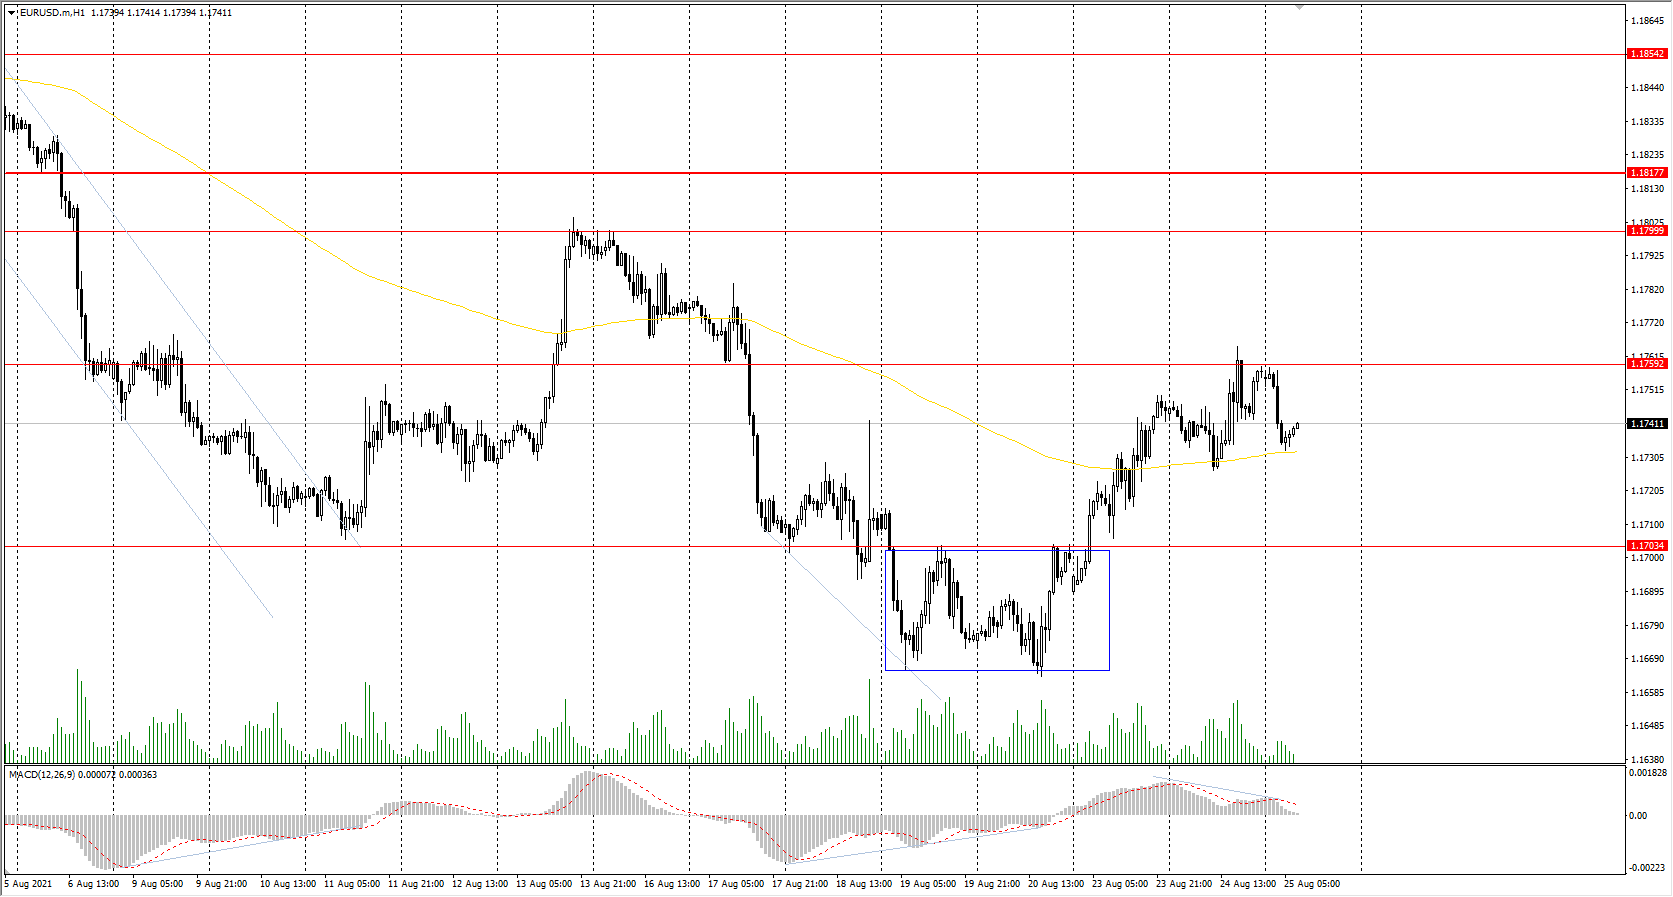
The EUR/USD currency pair
Technical indicators of the currency pair:
Prev Open: 1.1744
Prev Close: 1.1757
% chg. over the last day: +0.11%
Germany’s GDP increased by 1.6% in the second quarter. On an annual basis, Europe’s largest economy grew by 9.4%, leaving economic activity 3.3% below the pre-crisis level. The European economy is now recovering at a slightly faster pace than the US economy.
Trading recommendations
Support levels: 1.1704, 1.1620
Resistance levels: 1.1759, 1.1799, 1.1817, 1.1854, 1.1894, 1.1934, 1.1969
From a technical point of view, the general trend of the EUR/USD currency pair is bearish. The price is trading at the level of the moving average. The MACD indicator started signaling a divergence in the opposite direction. Under such market conditions, it is best to look for sell trades from the resistance levels, where sellers showed the initiative. Buy trades can only be considered intraday from the support levels where the buyers have shown the initiative. It is better to buy from the false breakdown zone around the 1.1703 level.
Alternative scenario: if the price breaks out through the 1.1817 resistance level and fixes above, the mid-term uptrend will likely resume.
News feed for 2021.08.25:
- German Ifo Business Climate (m/m) at 11:00 (GMT+3);
- US Core Durable Goods Orders (m/m) at 15:30 (GMT+3).
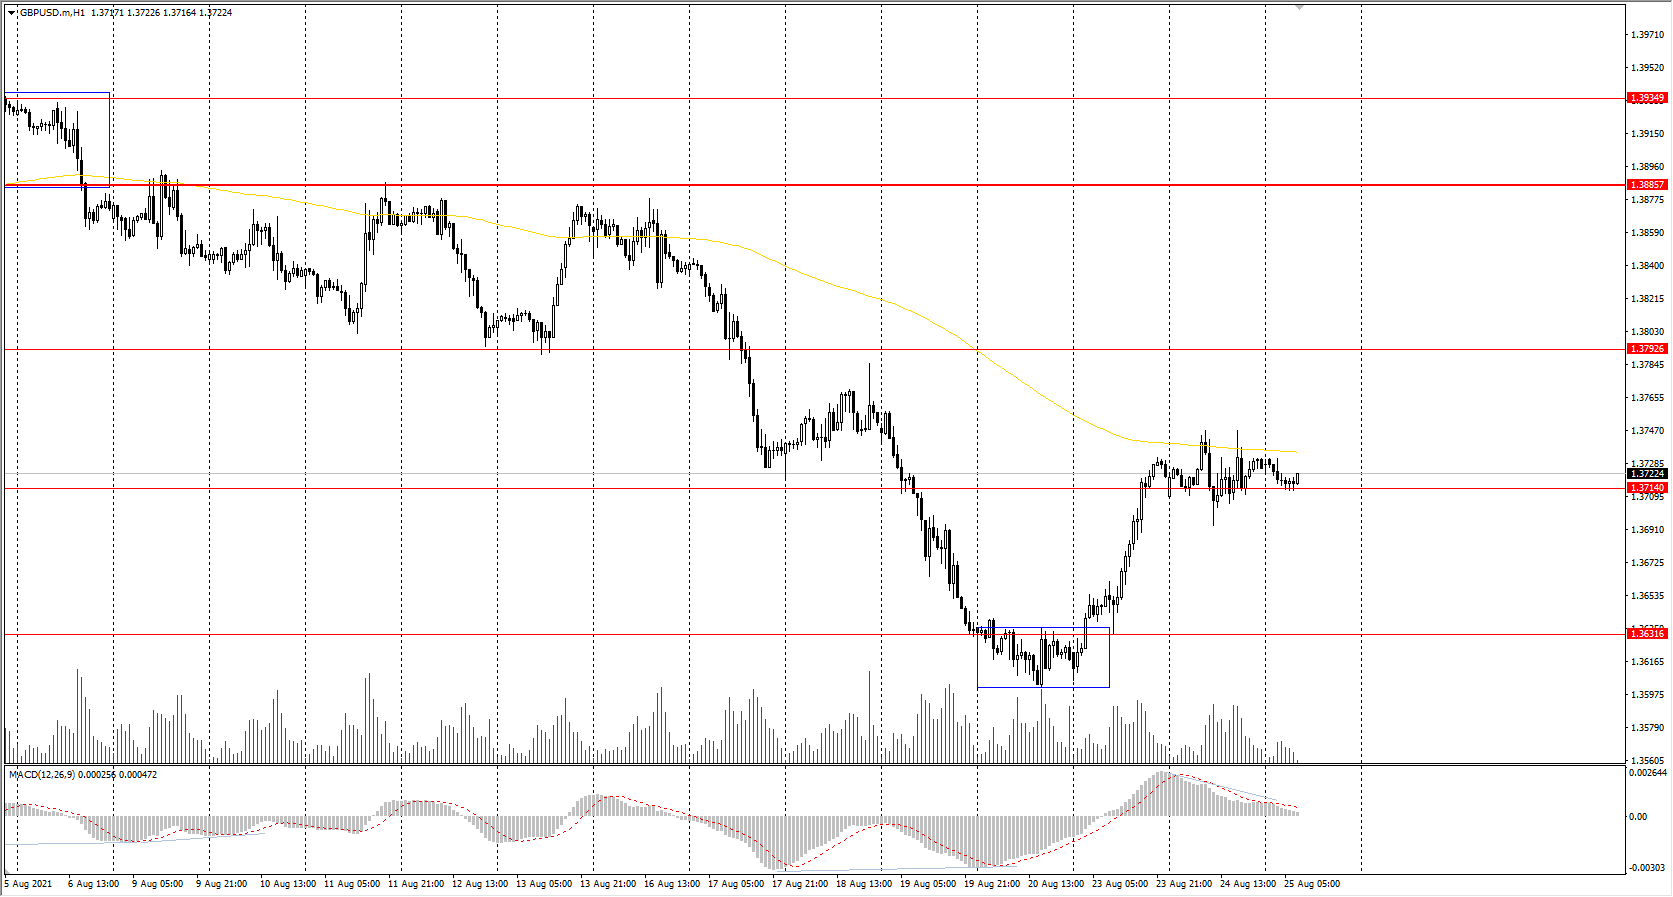
The GBP/USD currency pair
Technical indicators of the currency pair:
Prev Open: 1.3709
Prev Close: 1.3725
% chg. over the last day: +0.12%
The British pound continues to strengthen against the background of the dollar index decline. The increase in quotes is also due to the growth of Brent oil, which is increasing for the second session in a row.
Trading recommendations
Support levels: 1.3714, 1.3632, 1.3614, 1.3525
Resistance levels: 1.3793, 1.3772, 1.3886, 1.3935, 1.4002
On the hourly time frame, the GBP/USD trend is bearish. The price has consolidated above the support level and formed a false breakdown zone below. The MACD indicator has become positive, but there are signs of a hidden divergence. Under such market conditions, it is better to look for sell trades from the resistance levels. Buy positions can be considered only within the day and only with short targets.
Alternative scenario: if the price breaks out through the 1.3885 resistance level and consolidates above, the bullish scenario will likely resume.
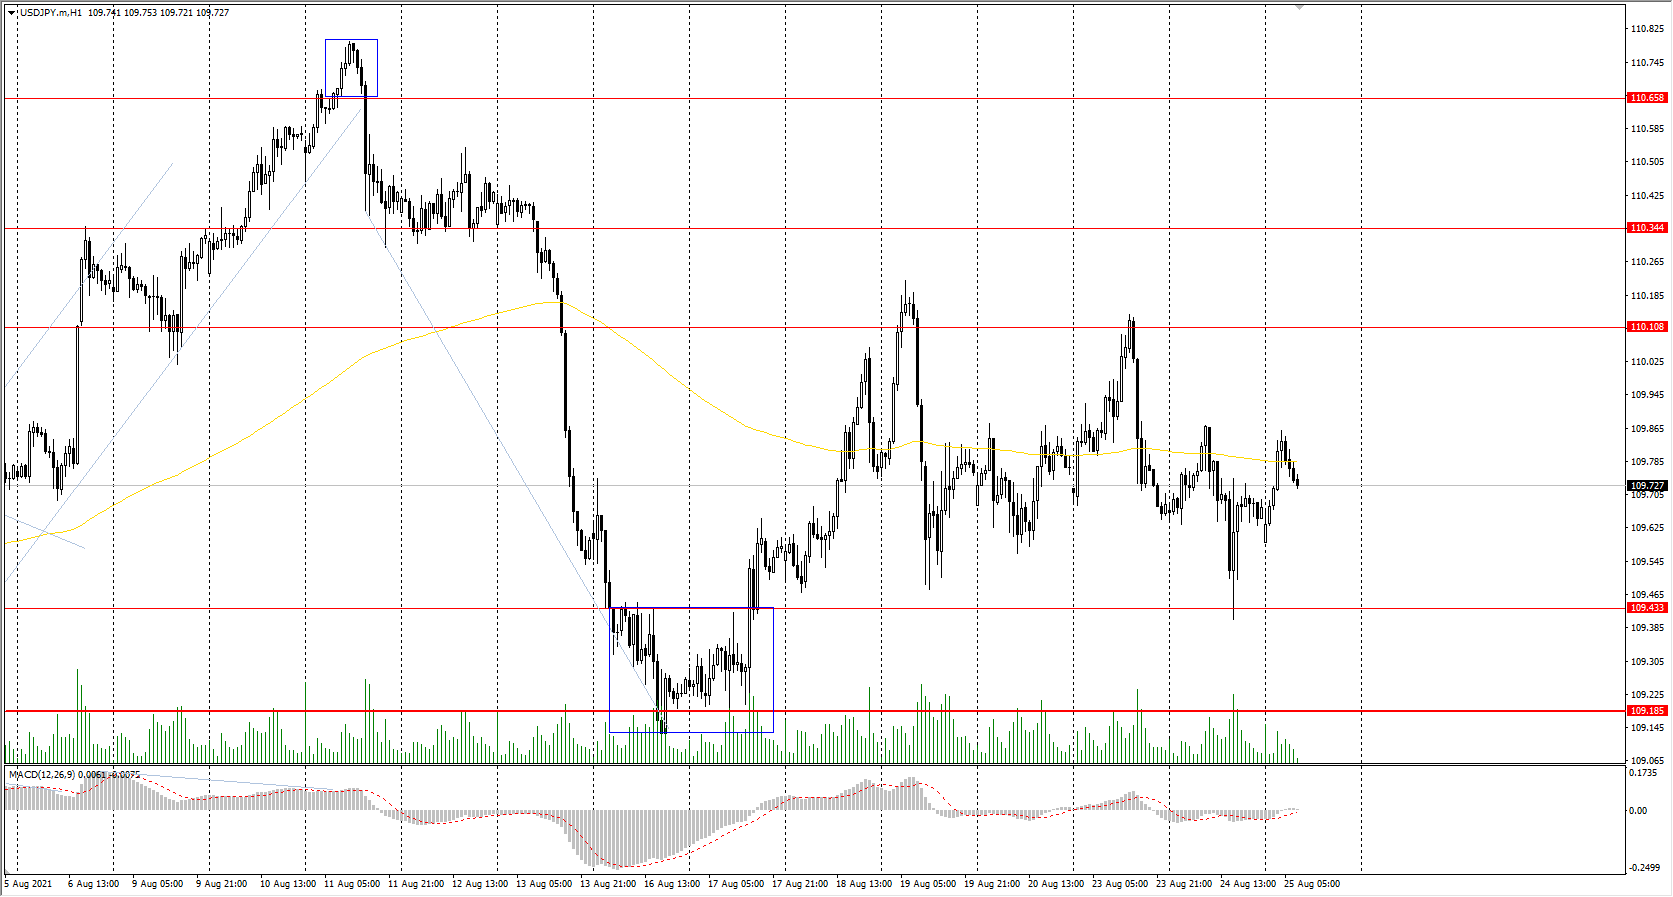
The USD/JPY currency pair
Technical indicators of the currency pair:
Prev Open: 109.68
Prev Close: 109.67
% chg. over the last day: -0.01%
In Japan, the situation with the spread of the Delta strain is worsening. According to the Ministry of Health, the country reported 21,500 new daily cases of COVID-19 and 42 deaths on Tuesday. Eight more prefectures were added to the state of emergency, bringing the total number of prefectures under quarantine to 21. The state of emergency will last until September 12. This situation will have a very negative impact on the economic performance for the quarter.
Trading recommendations
Support levels: 109.43, 109.19, 108.65
Resistance levels: 110.11, 110.34, 110.66, 110.95, 111.48
The main trend of the USD/JPY currency pair is bullish. The fall of the dollar index compensated for the negative impacts of the news. As a result, the USD/JPY currency pair is trading flat. The MACD indicator is inactive. Under such market conditions, it is best for traders to look for buy trades from the support level, where the buyers have shown initiative. Sell positions should be considered only on lower time frames from the resistance levels and only with short targets.
Alternative scenario: if the price falls below 109.18, the uptrend is likely to be broken.
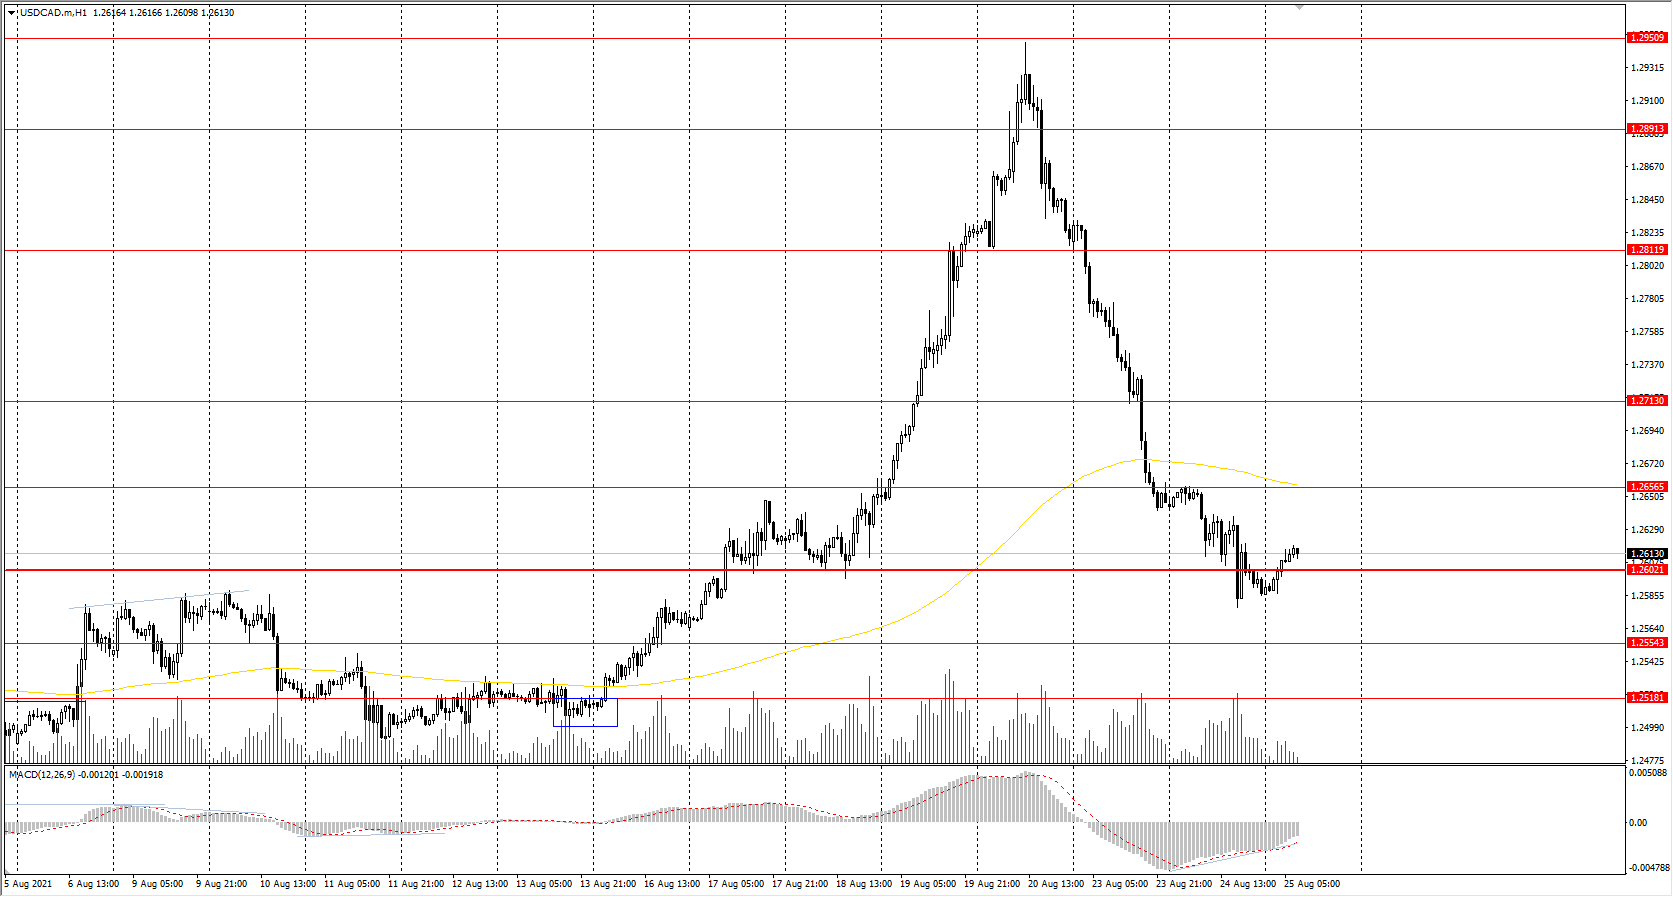
The USD/CAD currency pair
Technical indicators of the currency pair:
Prev Open: 1.2645
Prev Close: 1.2587
% chg. over the last day: -0.46%
The USD/CAD currency pair is highly dependent on the dynamics of the dollar index and oil prices. The dollar index is declining, while oil prices are rising for the second session in a row. As a result, the USD/CAD continues to decline. The USA’s statistics on crude oil reserves will be published today and significantly impact the USD/CAD behavior.
Trading recommendations
Support levels: 1.2602, 1.2554
Resistance levels: 1.2656, 1.2713, 1.2812, 1.2891, 1.2951
In terms of technical analysis, the USD/CAD trend is still bullish. But now, the price has approached the priority change level and tried to break it down yesterday but failed to consolidate below the level. The MACD indicator is signaling a divergence. It is better to look for buy positions from the priority change level after the buyer’s initiative. There are no optimal entry points for sell deals now because the support level is ahead.
Alternative scenario: if the price breaks down through the 1.2602 support level and fixes below, the uptrend will likely be broken.