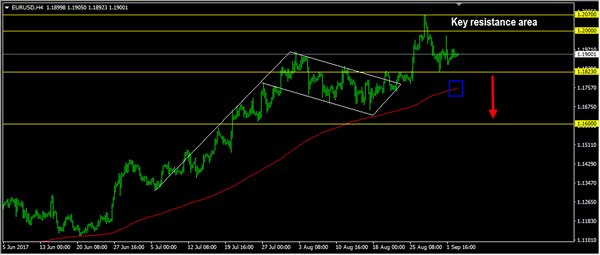
EURUSD
The EURUSD didn’t make significant movement yesterday. The bias remains neutral in nearest term. Overall I remain bullish and price is still moving above the EMA 200 as you can see on my H4 chart below but as long as stay below 1.2000 the pair is still in a bearish correction phase with key support seen at 1.1823. A clear break below that area would continue the bearish correction testing 1.1750 – 1.1700 area. On the upside, we need a clear break at least above 1.2000 to potentially end the current bearish correction phase targeting 1.2175 region.
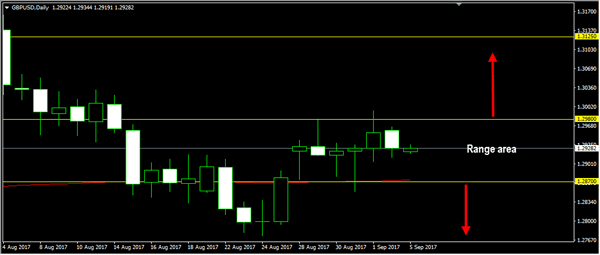
GBPUSD
The GBPUSD didn’t make significant movement yesterday and still trapped between 1.2980 – 1.2870 range area as you can see on my daily chart below. There are no changes in my technical outlook. The bias remains neutral in nearest term and we need a clear break from that range area to see clearer direction. A clear break and daily close above 1.2980 could trigger further bullish pressure testing 1.3030 before targeting 1.3125 region. On the other hand, a clear break and daily close below 1.2870 would expose 1.2700 area or lower. Overall I remain neutral.
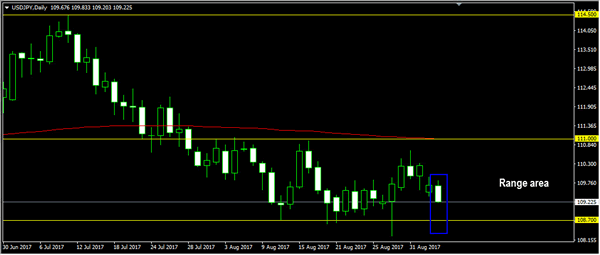
USDJPY
The USDJPY didn’t make significant movement yesterday but traded lower earlier today in Asian session hit 109.20. The bias is bearish in nearest term testing 108.70 key support. A clear break and daily close below that area could trigger further bearish pressure testing 108.00 – 107.50 area as nearest bearish target. Immediate resistance is seen around 109.83 (current high). A clear break above that area could lead price to neutral zone in nearest term as direction would become unclear. Overall I remain neutral.
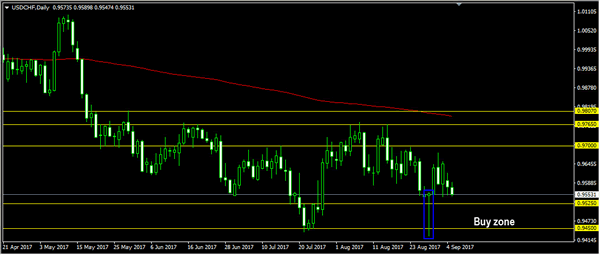
USDCHF
The USDCHF didn’t make significant movement yesterday. The bias remains neutral in nearest term probably with a little bearish bias testing 0.9525 support area. A clear break below that area could trigger further bearish pressure retesting 0.9450 key support which is a good place to buy with a tight stop loss. Immediate resistance is seen around 0.9589 (current high). A clear break above that area could trigger further bullish pressure testing 0.9650 – 0.9700 region. I still prefer to stand aside.