The Nasdaq 100 slumps as investors worry about moderating growth. The index is holding onto recent gains in the hope of reaching the next all-time high at 15800.
On the daily chart, the price’s divergence with moving averages combined with an overbought RSI could trigger mean reversion trades. The hourly chart is also painting an overextension.
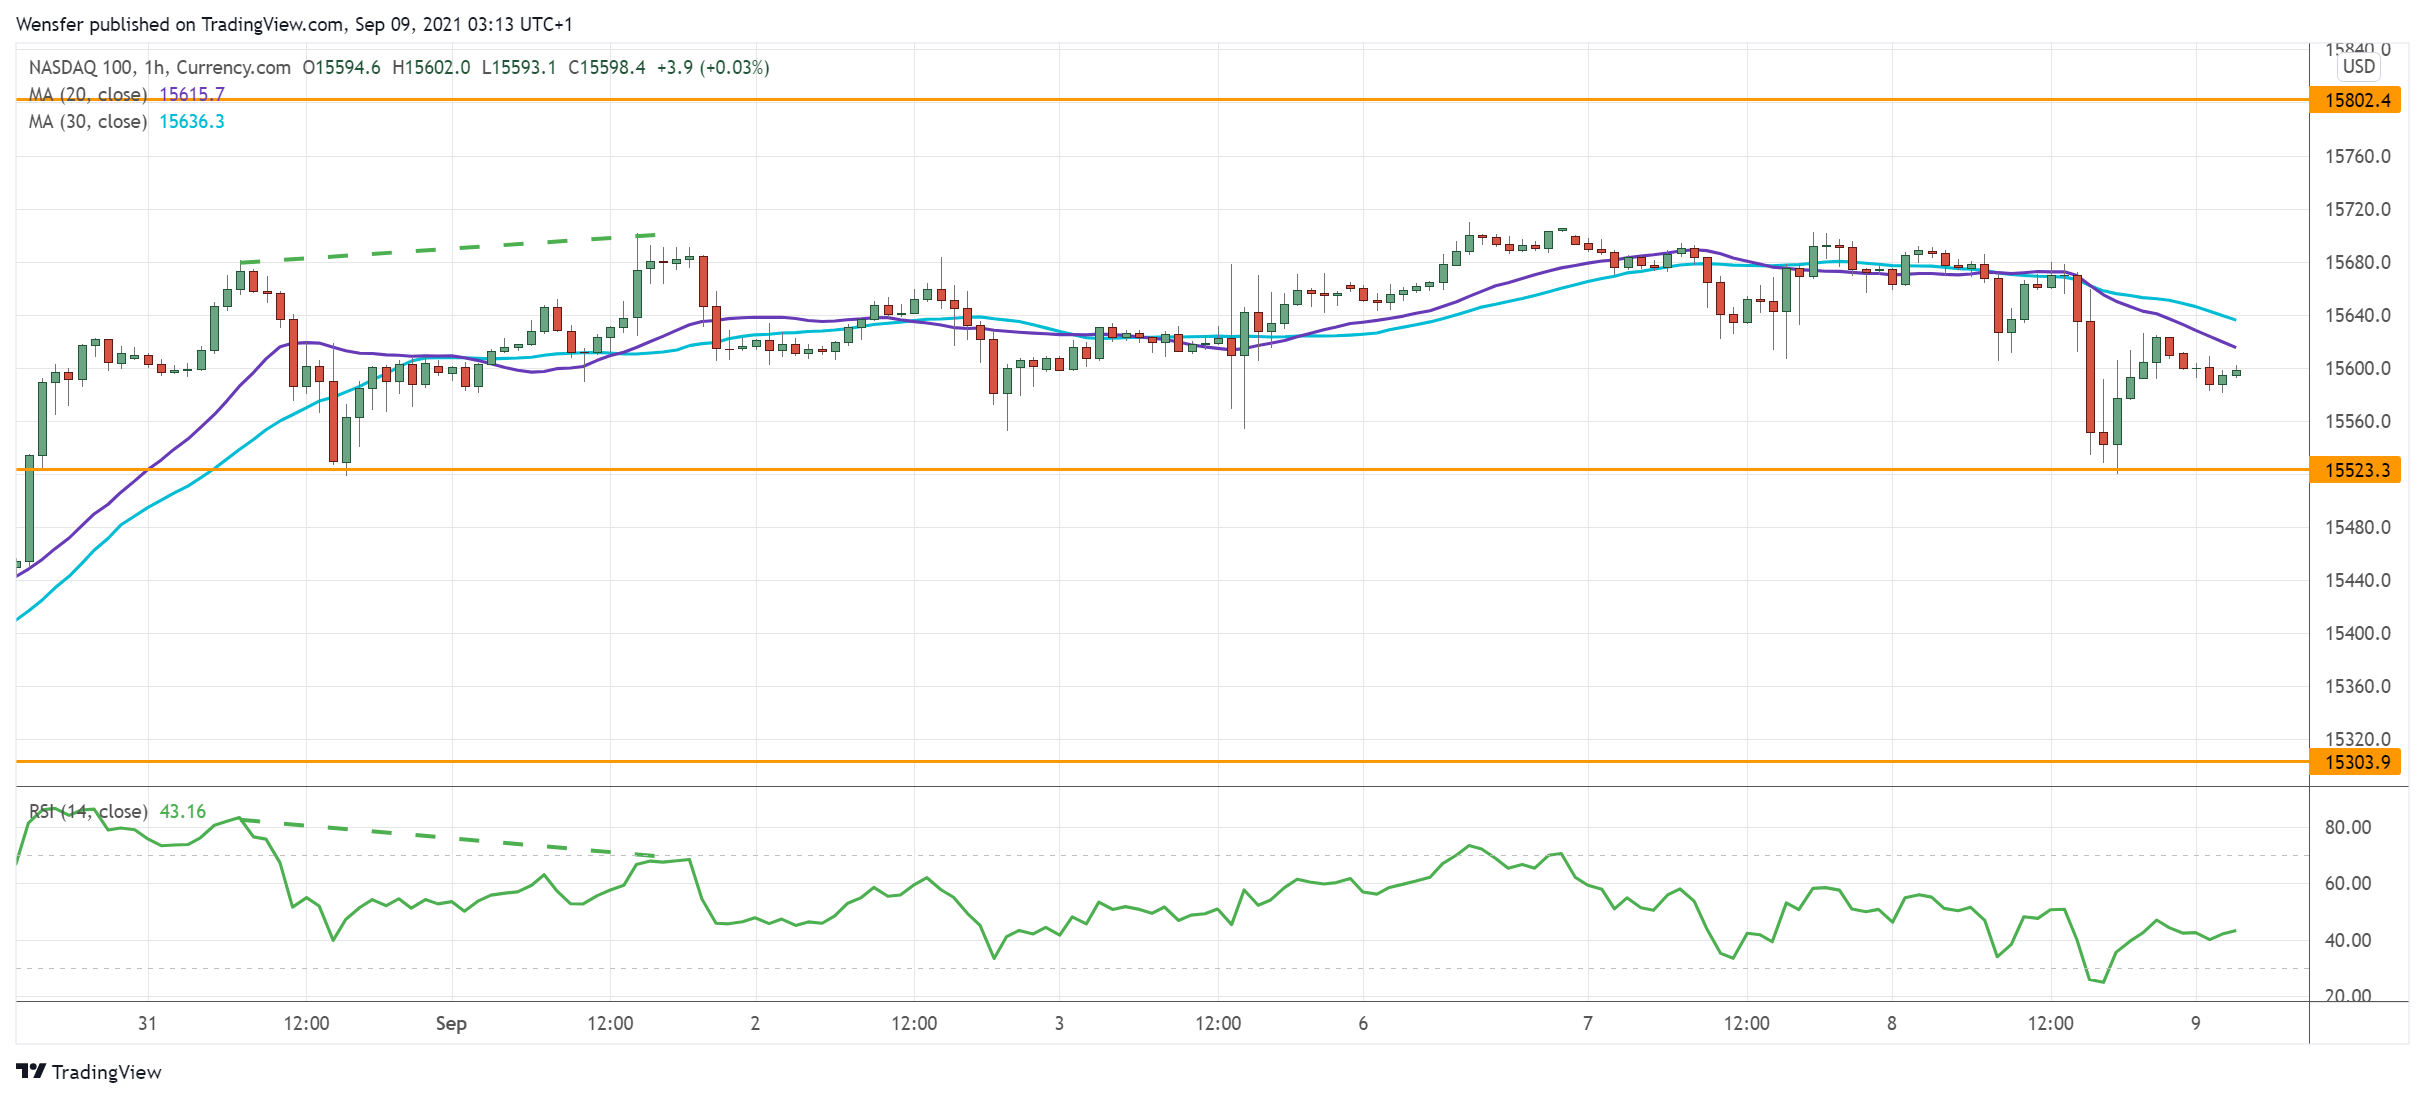
The RSI’s bearish divergence indicates a loss in upward momentum.
A fall below 15520 would prompt traders to take profit. 15300 is key support on the 30-day moving average.