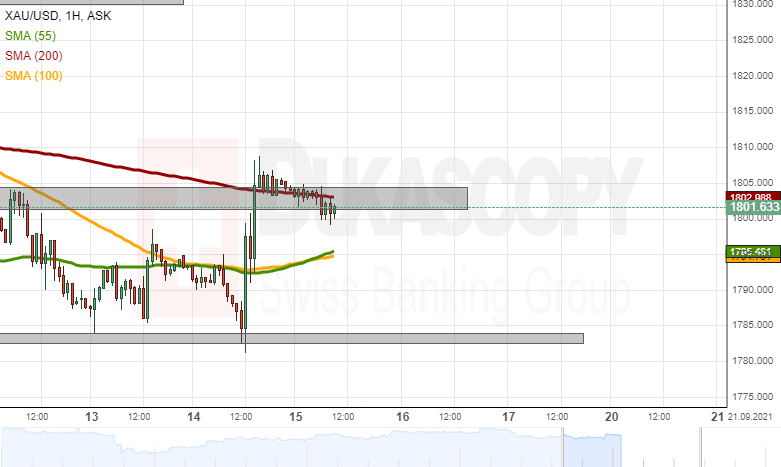
As the price for gold was testing the support zone below the 1,785.00 level, the US Consumer Price Index was released. The worse than forecast US data caused a drop of the value of the USD. Subsequently, the price of gold jumped.
During the three hour surge, the bullion broke above the resistance of the 200-hour SMA and the 1,800.00/1,805.00 resistance zone. The event signals that the price for gold might end sideways trading. However, by the middle of Wednesday’s trading, the price had reached below the 200-hour SMA and the 1,800.00 level.
If the yellow metal declines, support could be provided by the 55 and 100-hour SMAs near 1,795.50. However, these levels failed to impact the price throughout this week. Due to that reason, it is a high possibility that the support zone below 1,785.00 could once again be reached.
On the other hand, a surge of gold would test the 200-hour SMA and the 1,800.00/1,805.00 zone before reaching new high levels like the summer high zone at 1,830.00/1,835.00.