The EUR/USD currency pair
Technical indicators of the currency pair:
Prev Open: 1.1551
Prev Close: 1.1574
% chg. over the last day: +0.20%
Europe may face gas shortages this winter if cold weather exhausts reserves to zero, making the region completely dependent on additional flows from Russia. In turn, some European politicians blame Russia for the low volume of gas stored in the region, which has led to record increases in gas and electricity prices.
Trading recommendations
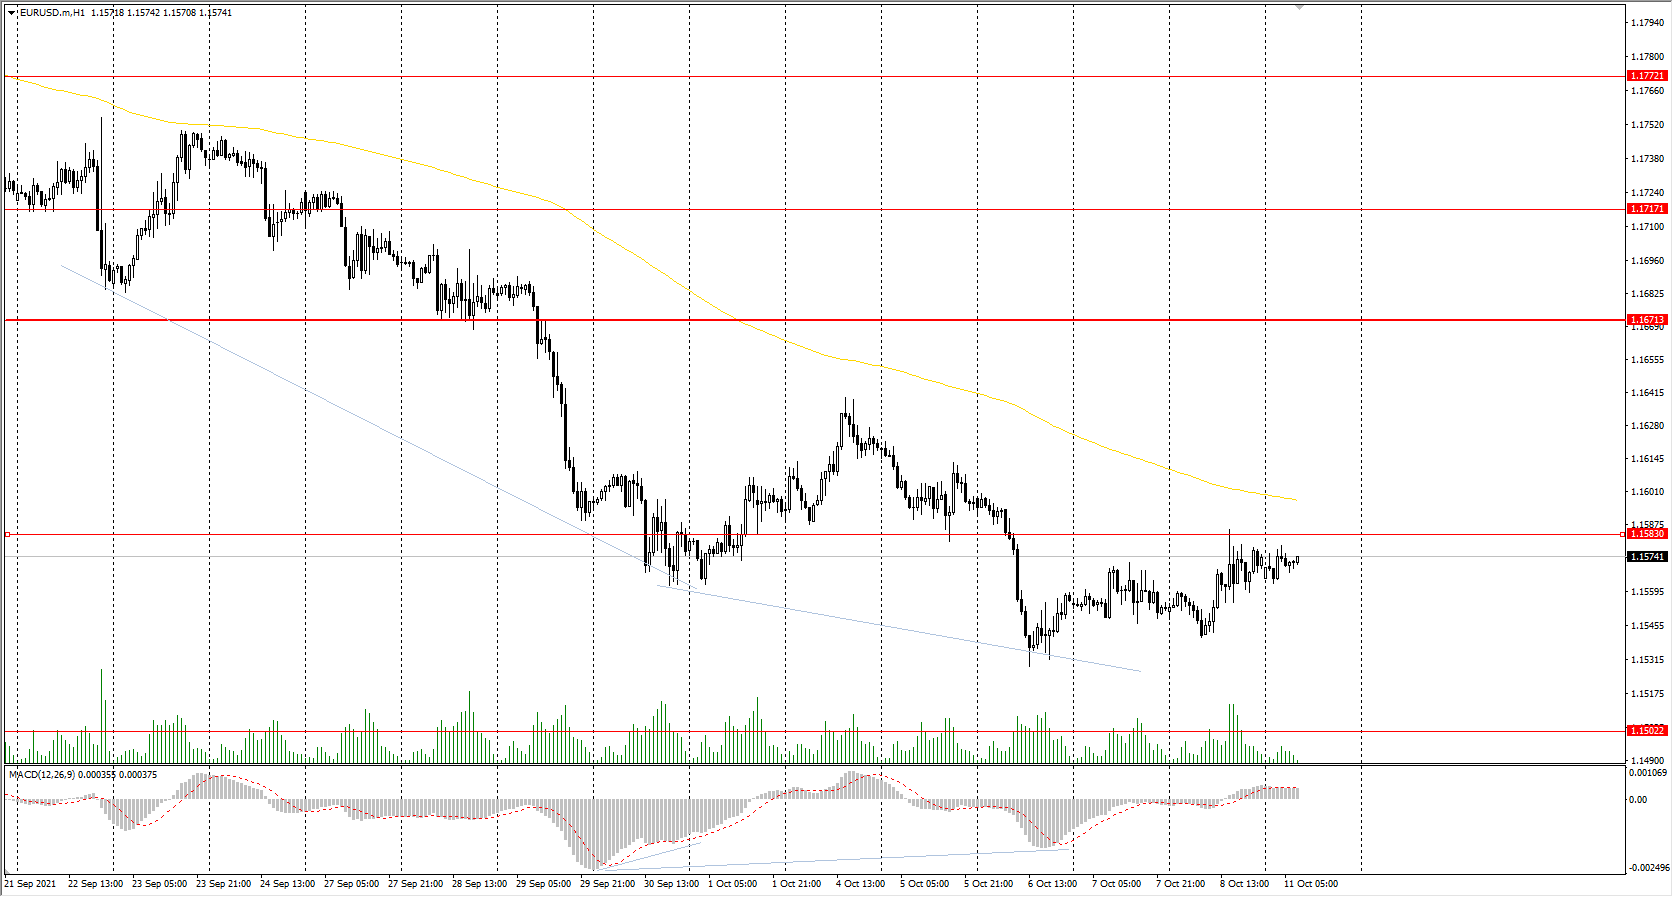
Support levels: 1.1502, 1.1453
Resistance levels: 1.1583, 1.1671, 1.1717, 1.1772, 1.1802, 1.1835
From the technical point of view, the EUR/USD trend is bearish. The MACD has become positive. Under such market conditions, traders should consider sell deals from the resistance levels near the moving average, as the price has deviated from the middle line. Buy trades should be considered only from the support levels with additional confirmation in the form of a buyers’ initiative.
Alternative scenario: if the price breaks out through the 1.1671 resistance level and fixes above, the mid-term uptrend will likely resume.
The GBP/USD currency pair
Technical indicators of the currency pair:
Prev Open: 1.3606
Prev Close: 1.3611
% chg. over the last day: +0.04%
In addition to problems with truck drivers, Britain also faces a pilot shortage, which can prevent the resumption of the travel industry after hundreds of airline crew retired or changed careers during the pandemic. Britain’s business secretary, Kwasi Kwarteng, says that inflation is a concern, but the country’s central bank will do its best to keep it at a moderate level.
Trading recommendations
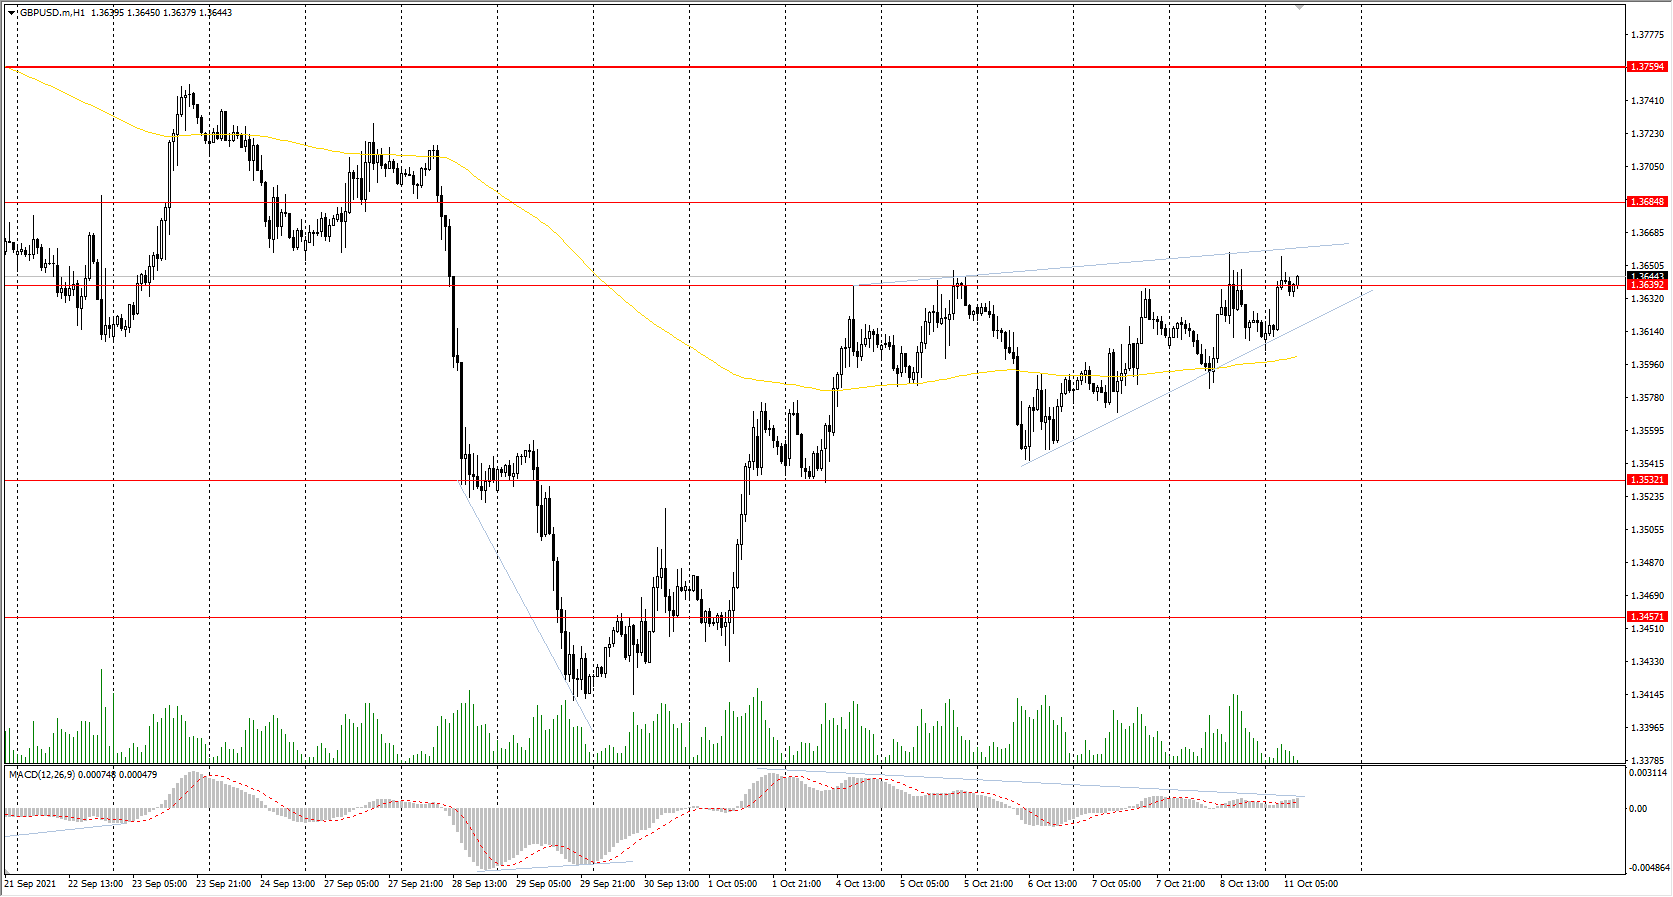
Support levels: 1.3532, 1.3457, 1.3360, 1.3282
Resistance levels: 1.3639, 1.3685, 1.3759, 1.3812, 1.3886
On the hourly time frame, the GBP/USD trend is bearish. But the British currency looks more confident than the euro due to a direct correlation with oil prices. The MACD indicator is in the positive zone but with signs of divergence. There are also signs of narrowing liquidity in the form of a triangle pattern. Buy trades should be considered only within the day and only after the buyer’s initiative upward from the triangle. It is best to look for sell trades after the price breaks down the triangle.
Alternative scenario: if the price breaks out through the 1.3759 resistance level and consolidates above, the bullish scenario will likely resume.
The GBP/USD currency pair
Technical indicators of the currency pair:
Prev Open: 1.3606
Prev Close: 1.3611
% chg. over the last day: +0.04%
In addition to problems with truck drivers, Britain also faces a pilot shortage, which can prevent the resumption of the travel industry after hundreds of airline crew retired or changed careers during the pandemic. Britain’s business secretary, Kwasi Kwarteng, says that inflation is a concern, but the country’s central bank will do its best to keep it at a moderate level.
Trading recommendations
Support levels: 1.3532, 1.3457, 1.3360, 1.3282
Resistance levels: 1.3639, 1.3685, 1.3759, 1.3812, 1.3886
On the hourly time frame, the GBP/USD trend is bearish. But the British currency looks more confident than the euro due to a direct correlation with oil prices. The MACD indicator is in the positive zone but with signs of divergence. There are also signs of narrowing liquidity in the form of a triangle pattern. Buy trades should be considered only within the day and only after the buyer’s initiative upward from the triangle. It is best to look for sell trades after the price breaks down the triangle.
Alternative scenario: if the price breaks out through the 1.3759 resistance level and consolidates above, the bullish scenario will likely resume.
The USD/JPY currency pair
Technical indicators of the currency pair:
Prev Open: 111.61
Prev Close: 112.21
% chg. over the last day: +0.53%
Japan’s new Prime Minister, Fumio Kishida, says he has no plans to change capital gains and dividend taxes, as he intends to take other steps to distribute wealth better, such as raising healthcare workers’ salaries. The Japanese yen was declining all week as investors were concerned that the new prime minister may go ahead with a capital gains tax hike and move away from the investor-friendly economic policies conducted by Japanese Prime Minister Shinzo Abe from 2013 to 2020.
Trading recommendations
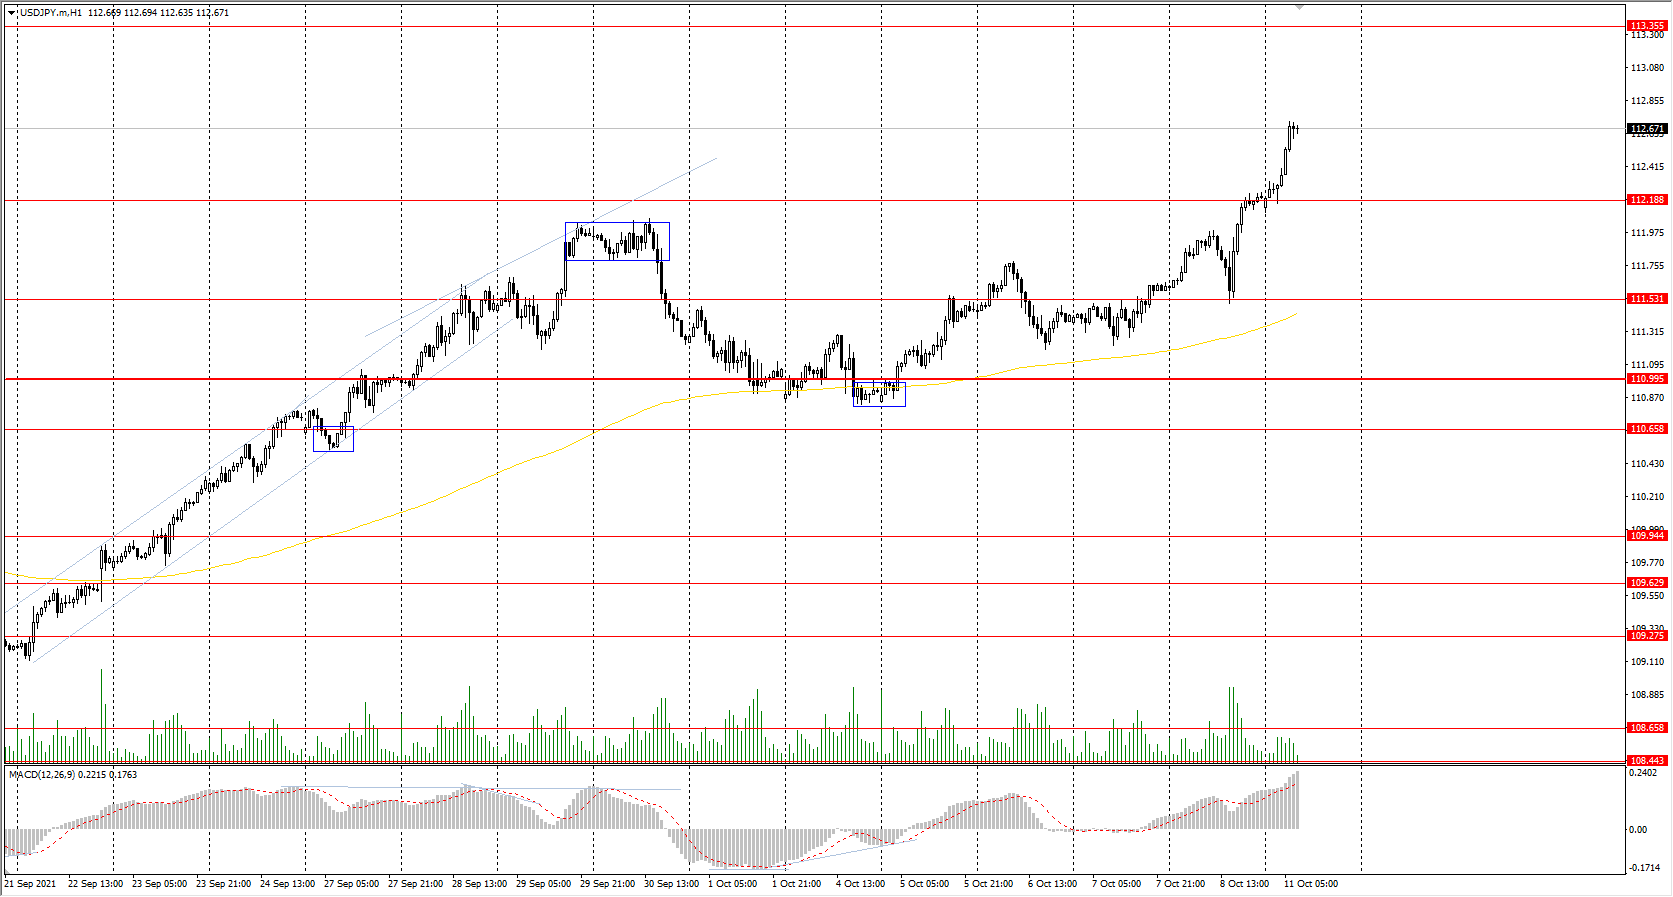
Support levels: 112.19, 111.53, 110.99, 110.65, 109.95, 109.63
Resistance levels: 113.35
The main trend of the USD/JPY currency pair is bullish. The Japanese yen is rapidly declining against the US dollar; the last time such a price was in April 2019. The MACD indicator is positive again, and there are signs of overbuying but no signs of reversal. Under such market conditions, it’s better to look for buy positions from the support levels near the moving average, as the price has deviated strongly from the average line. Sell positions should be considered only throughout the day from the resistance levels, given there is sellers’ initiative.
Alternative scenario: if the price falls below 110.99, the uptrend is likely to be broken.