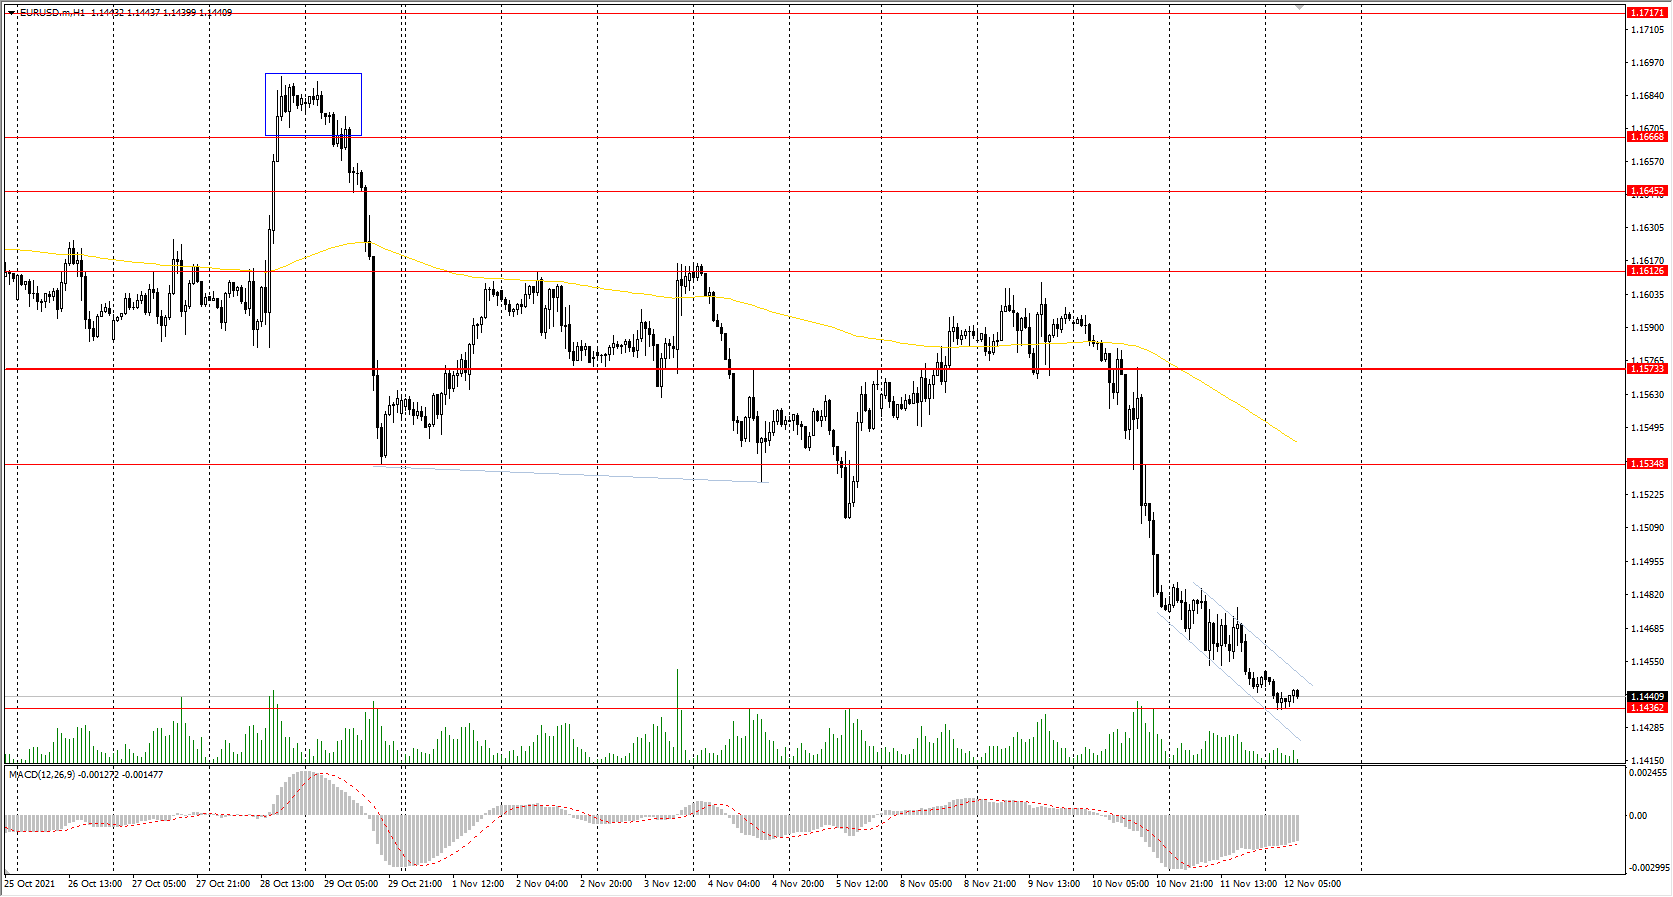
The EUR/USD currency pair
Technical indicators of the currency pair:
Prev Open: 1.1475
Prev Close: 1.1449
% chg. over the last day: -0.23%
Europe’s GDP forecasts continue to fall as the economic recovery slows and the number of Covid cases reaches an all-time high. The German government’s economic advisory group lowered its 2021 economic growth forecast to 2.7%. Eurozone inflation could exceed forecasts if supply chain disruptions persist.
Trading recommendations
Support levels: 1.1436
Resistance levels: 1.1535, 1.1573, 1.1613, 1.1645, 1.1667, 1.1717, 1.1772
From the technical point of view, the EUR/USD on the hour time frame is bearish. The MACD indicator has become negative, but there is a divergence on the higher time frames. Under such market conditions, traders should consider sell positions from the resistance levels near the moving average, as the price has deviated strongly from the averages. Buy trades should be considered only from the support levels of the higher time frame, given the buyer’s initiative.
Alternative scenario: if the price breaks out through the 1.1573 resistance level and fixes above, the mid-term uptrend will likely resume.
News feed for 2021.11.12:
- Eurozone Industrial Production (m/m) at 12:00 (GMT+2);
- US JOLTs Job Openings (m/m) at 17:00 (GMT+2);
- US Michigan Consumer Sentiment (m/m) at 17:00 (GMT+2);
- US FOMC Member Williams’s Speech at 19:10 (GMT+2).
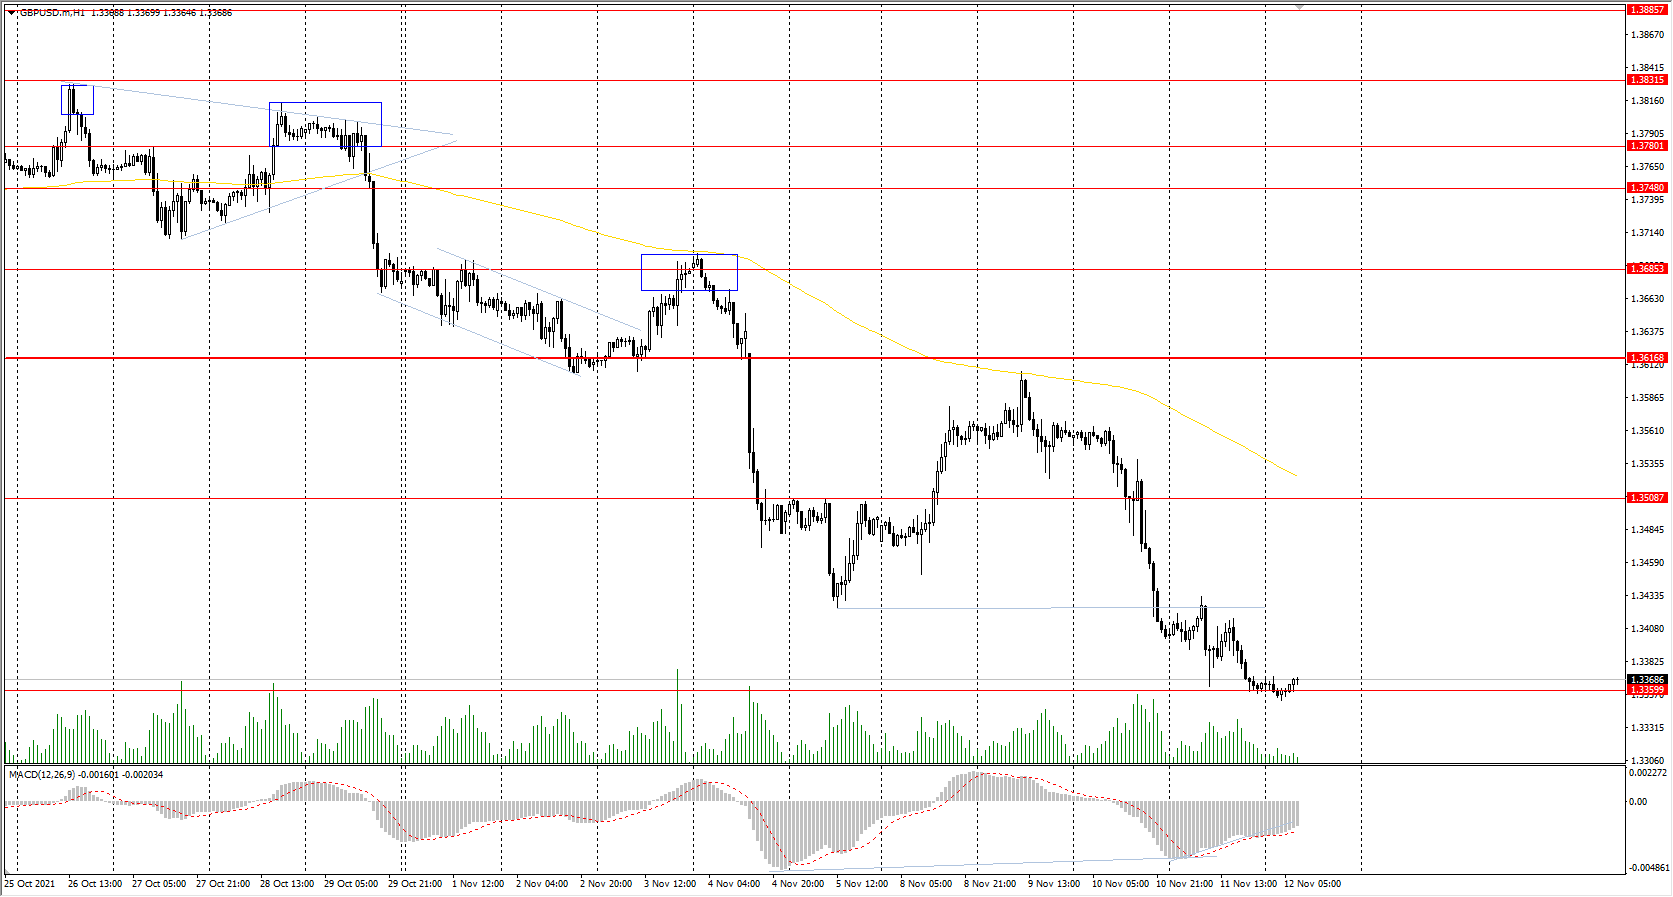
The GBP/USD currency pair
Technical indicators of the currency pair:
Prev Open: 1.3403
Prev Close: 1.3365
% chg. over the last day: -0.28%
UK GDP growth for the quarter was only 1.3% (forecast 1.5%, previous 5.5%). Industrial production data also showed a decline in activity. All these factors indicate a clear slowdown in the economy.
Trading recommendations
Support levels: 1.3360
Resistance levels: 1.3508, 1.3616, 1.3685, 1.3748, 1.3780, 1.3831, 1.3886
On the hourly time frame, the trend on GBP/USD is bearish. The MACD indicator has become negative, but there is a divergence on the higher time frames. Under such market conditions, traders should consider sell positions from the resistance levels near the moving average, as the price has deviated strongly from the averages. Buy trades should be considered only from the support levels of the higher time frame, given the buyer’s initiative.
Alternative scenario: if the price breaks out through the 1.3617 resistance level and consolidates above, the bullish scenario will likely resume.
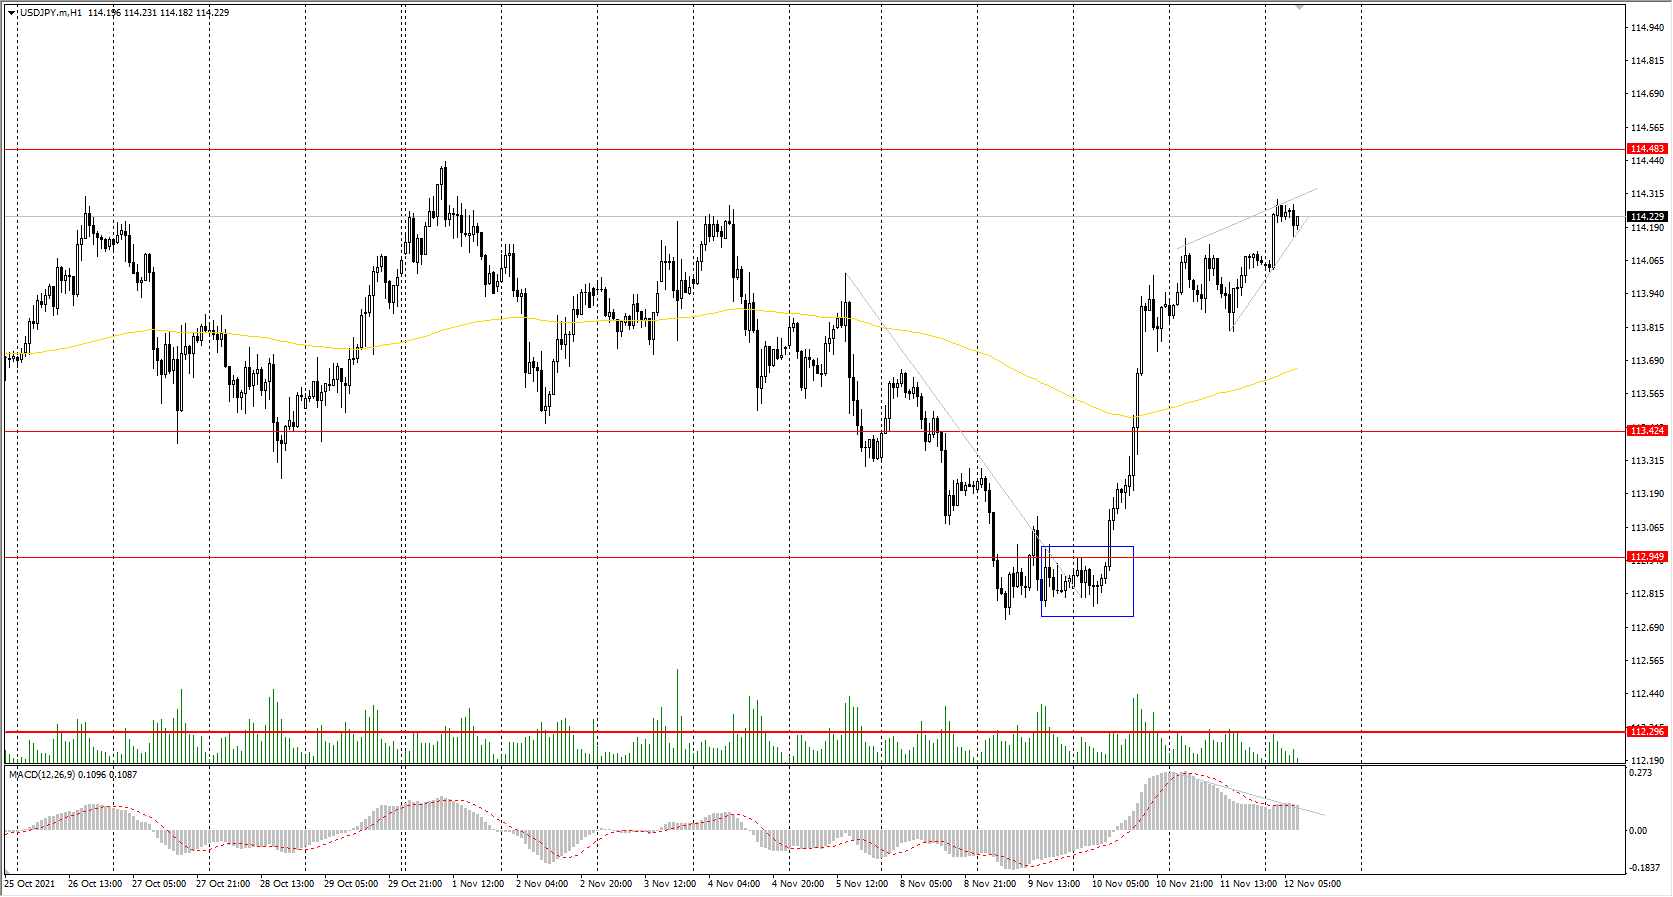
The USD/JPY currency pair
Technical indicators of the currency pair:
Prev Open: 113.90
Prev Close: 114.06
% chg. over the last day: +0.14%
At the moment, there are no fundamental reasons for the USD/JPY quotes to go down in the mid-term, as the Bank of Japan has kept its monetary policy soft until the end of the year. At the same time, the Fed is already cutting QE and is likely to accelerate cuts due to a sharp rise in inflation. Also, Japan’s new government will present a new tens of billions of dollars stimulus program in the coming days, which will eventually lead to a lower national exchange rate.
Trading recommendations
Support levels: 113.42, 112.95, 112.30, 111.53, 110.99, 110.65
Resistance levels: 114.48, 115.15
The global trend on the USD/JPY currency pair is bullish. The local trend has also changed to upward. But the MACD indicator shows a divergence, which suggests that a technical correction downwards should be expected soon. Under such market conditions, it’s better to look for buy positions from the buyers’ initiative zone near the moving average. Sell positions should be considered from the resistance levels of higher time frames, given there is sellers’ initiative, but only with short targets.
Alternative scenario: if the price falls below 112.30, the uptrend will likely be broken.
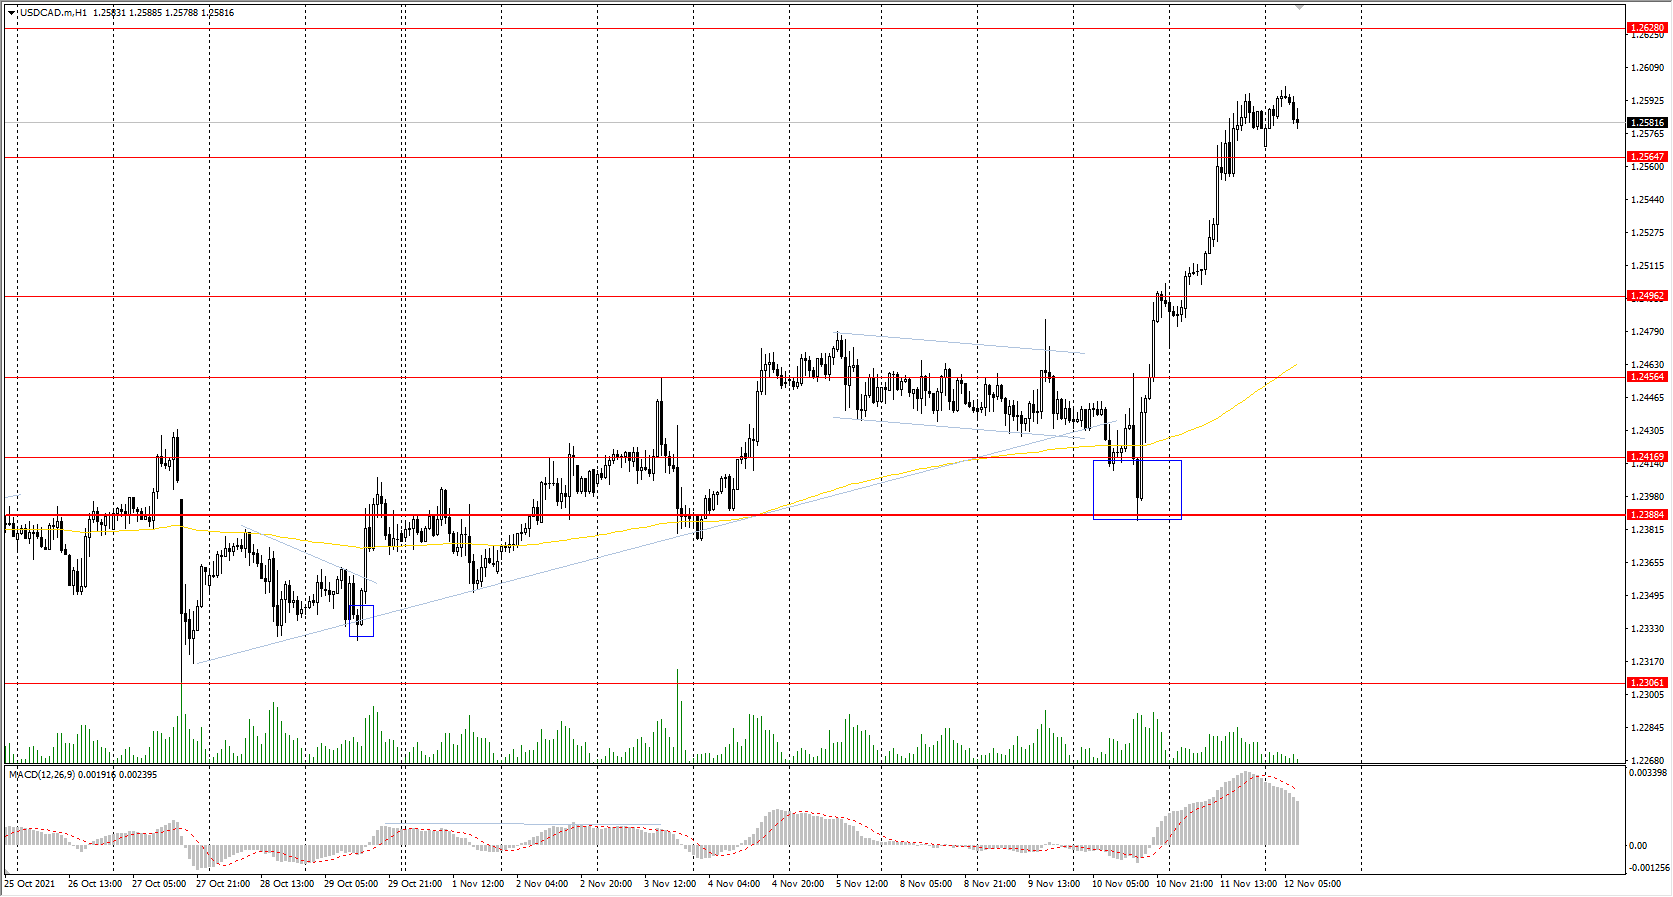
The USD/CAD currency pair
Technical indicators of the currency pair:
Prev Open: 1.2493
Prev Close: 1.2579
% chg. over the last day: +0.69%
The Canadian dollar is a commodity currency, so the USD/CAD currency pair highly depends on the dynamics of the dollar index and oil prices. Against the inflation growth in the USA, the dollar index is increasing, while oil quotes are decreasing. As a result, the USD/CAD are showing steady growth.
Trading recommendations
Support levels: 1.2564, 1.2496, 1.2456, 1.2417, 1.2388
Resistance levels: 1.2628, 1.2729, 1.2774
From a technical point of view, the trend of the USD/CAD currency is bullish. The MACD indicator is in the positive zone, but there are signs of overbought. Under such market conditions, it is better to look for buy trades from the support levels near the moving average, as the price has deviated strongly from its averages. Sell deals should be considered from the resistance levels of the higher time frame.
Alternative scenario: if the price breaks down through the 1.2388 support level and fixes below, the downtrend will likely resume.