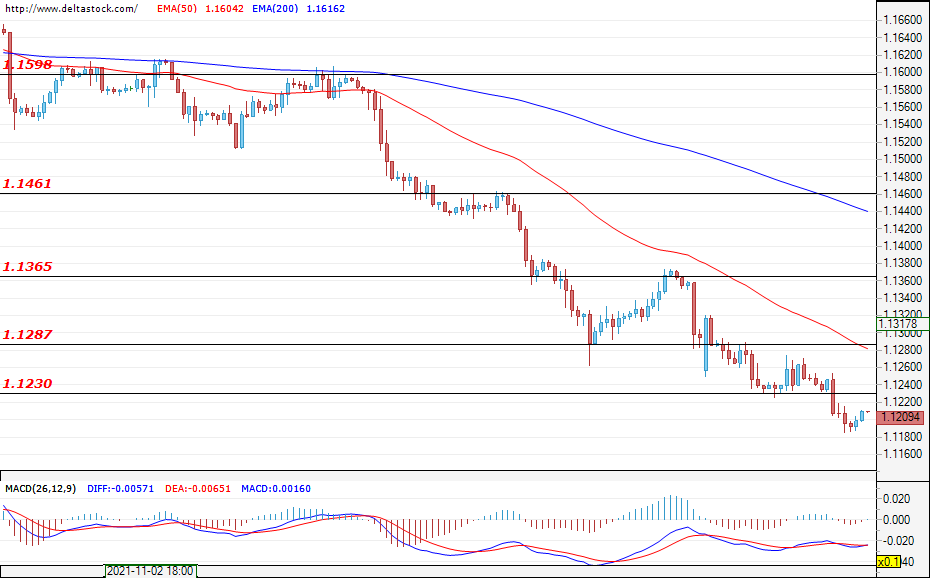
EUR/USD
Current level – 1.109
The common European currency continued to lose ground against the dollar and the pair breached the last support zone at 1.1230 as speculations mounted for an earlier-than-expected interest hike by the Fed. A confirmation of the breach would lead to new losses for the EUR/USD and could easily head the pair towards 1.1125. The first target for the bulls is the mentioned level at 1.1230, which is now acting as a resistance, followed by the zone at 1.1290.
| Resistance | Support | ||
| intraday | intraweek | intraday | intraweek |
| 1.1230 | 1.1365 | 1.1180 | 1.1125 |
| 1.1287 | 1.1461 | 1.1125 | 1.1060 |
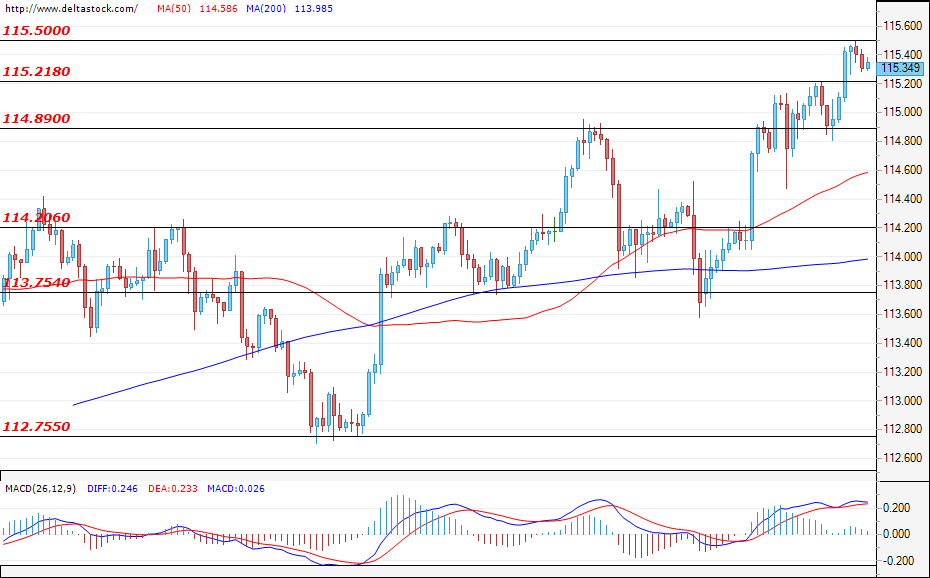
USD/JPY
Current level – 115.34
The bulls managed to gain enough momentum and, after the successful violation of the resistance zone at 115.21, the currency pair tested the next target at 115.50. At the time of writing the analysis, the Ninja is hovering around 115.34 and a new attack on the last resistance is a highly probable scenario. A breach for the buyers would easily continue the rally and lead to new gains for the dollar against the yen. If the bears enter the market, the correction could be limited down to the support at 114.89.
| Resistance | Support | ||
| intraday | intraweek | intraday | intraweek |
| 115.50 | 116.50 | 115.21 | 114.20 |
| 116.50 | 117.00 | 114.89 | 113.75 |
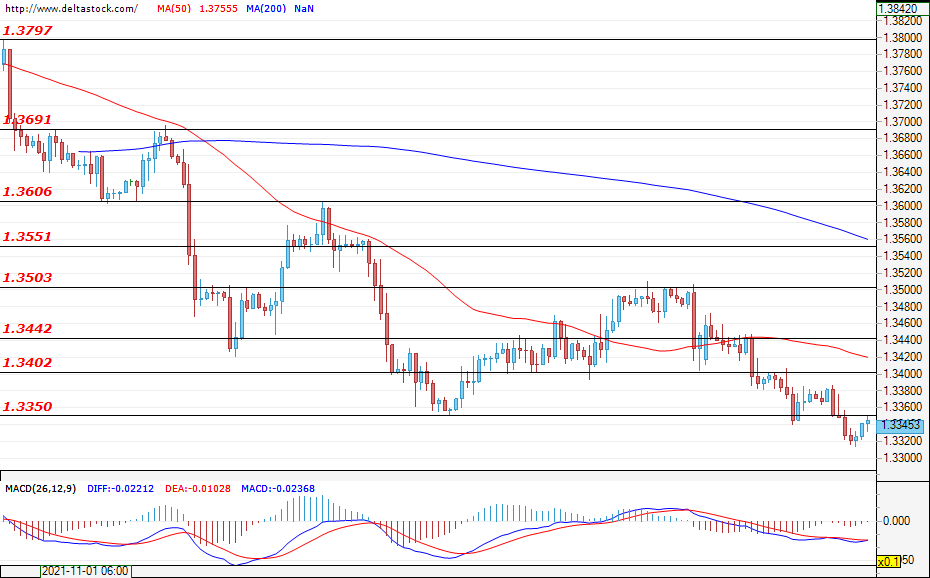
GBP/USD
Current level – 1.3345
The breach of the support at 1.3350 is being confirmed and, during the early hours of today`s trading, the price is hovering just below the mentioned zone. If the bulls prevail, a retracement could lead to a test of the close resistance zone at 1.3402. Only a violation of the zone at 1.3442, followed by a breach of the upper target at 1.3500, could strengthen the positive expectations for the future path of the GBP/USD. If the bears remain in control and the breach of 1.3350 is confirmed, new losses for the pound against the dollar and a move towards 1.3300 can be expected.
| Resistance | Support | ||
| intraday | intraweek | intraday | intraweek |
| 1.3400 | 1.3500 | 1.3320 | 1.3200 |
| 1.3440 | 1.3550 | 1.3300 | 1.3060 |