
Key Highlights
- GBP/USD started a fresh decline from the 1.3375 level.
- It is trading below a major support at 1.3280 on the 4-hours chart.
- EUR/USD could make another attempt to clear 1.1350.
- Crude oil price extended decline below the $70.00 support.
GBP/USD Technical Analysis
The British Pound failed to stay above 1.3350 against the US Dollar. GBP/USD started a fresh decline below the 1.3300 support zone.
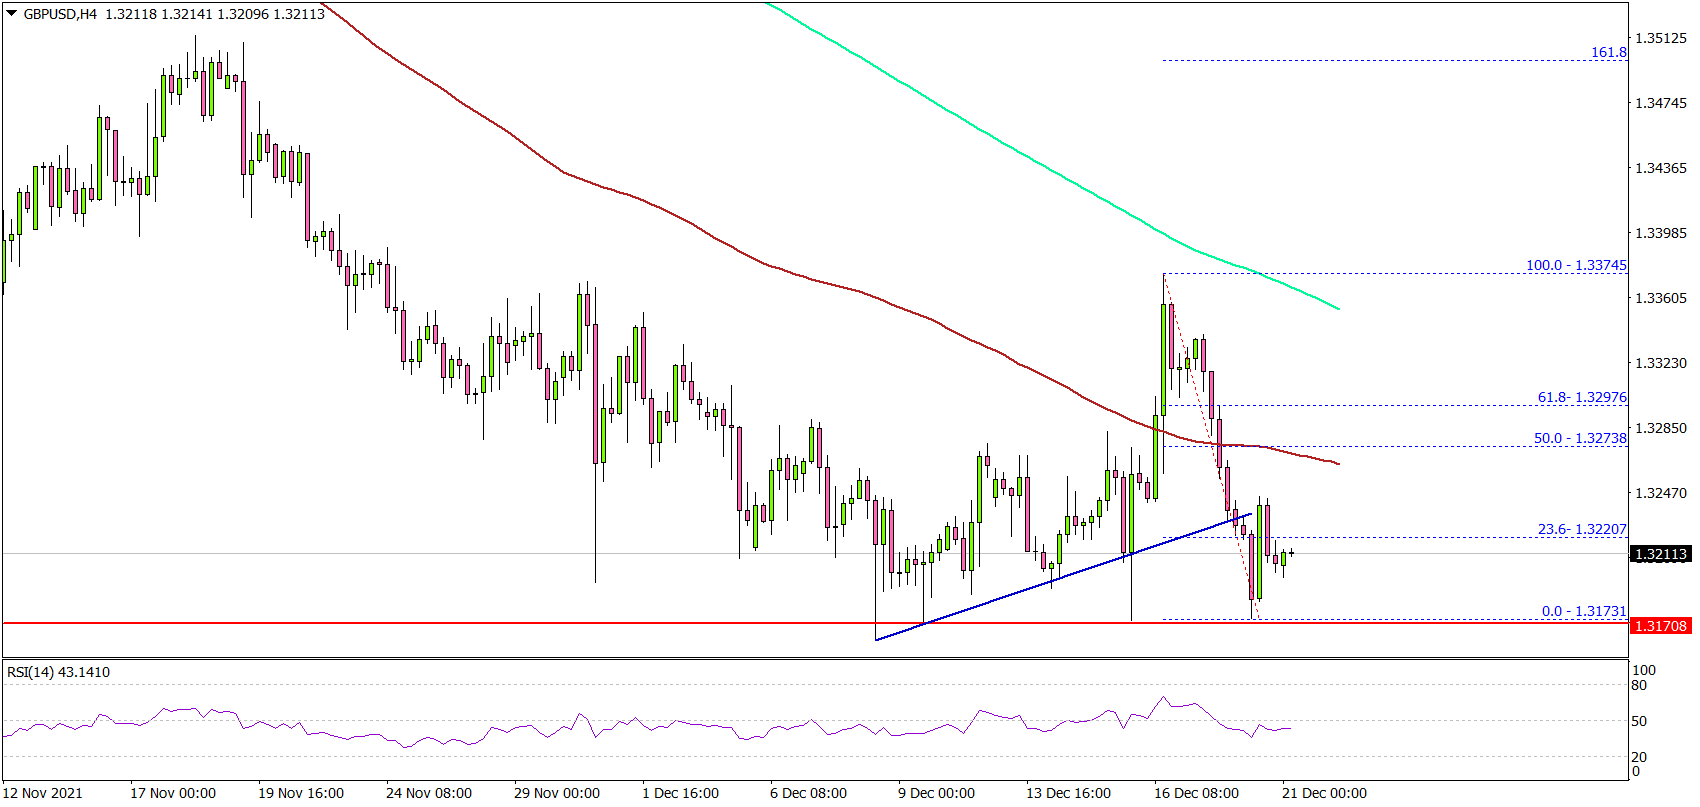
Looking at the 4-hours chart, the pair traded below the 1.3280 and 1.3250 support levels. Besides, there was a clear move below a bullish trend line at 1.3235. The pair traded below 1.3200 and settled below the 100 simple moving average (red, 4-hours) and the 200 simple moving average (green, 4-hours).
The pair found support near 1.3175 and started consolidating loses. An immediate support is near the 1.3175 level. The next key support is 1.3150, below which the pair could dive towards the 1.3100 level.
A close below 1.3100 could open the doors for a move towards 1.3000. On the upside, the first key resistance is near the 1.3280 level. The next key resistance is near the 1.3300 level. A successful daily close above 1.3300 could open the doors for a steady increase. The next stop for the bulls might be 1.3375.
Looking at EUR/USD, the pair found support near 1.1220, but it could face a strong resistance near the 1.1350 zone.
Economic Releases
- Canadian Retail Sales for Oct 2021 (MoM) – Forecast 1%, versus -0.6% previous.
- Canadian Retail Sales ex Autos for Oct 2021 (MoM) – Forecast +0.8%, versus -0.2% previous.


