
WTI prices continue to ascend and reach new weekly highs for the third consecutive week. Oil prices have been rising since the start of December possibly signaling some bullish fundamentals are currently unfolding. Through this report we aim to present the key fundamentals currently running the Oil market and how they can affect the commodity’s price. Towards the end we will present a technical analysis that will cover for the recent price action and levels involved.
On the 5th of January the EIA released its weekly Crude Oil Stockpiles figure. The reading is among the top monitored by Oil traders thus its significance is in most cases mirrored with price reaction. Upon release the indicator displayed a drawdown of -2.14M barrels which initially sent WTI prices lower yet the commodity regained ground and stabilized shortly. This was the 6th consecutive weekly drawdown by the EIA a fact that overall could be sending a bullish message to traders. On a similar note on the 4th of January the American Petroleum Institute reported its inventory levels of US crude oil with a large drawdown of -6.43M barrels being released. In the following minutes of the release, WTI’s price gained support as this was the largest among the last 6 consecutive drawdowns. In the US, active Oil rigs continue to be on the rise and are currently at 480 as indicated by the U.S. Baker Hughes Oil Rig Count during the past Friday. In our view active Oil rigs are heading to 500 which can also be used as a bullish sign. Overall the readings for the past days seem to be in line with the upward movement by WTI prices.
Moving to the OPEC front, during the group’s 24th OPEC and non-OPEC Ministerial Meeting the decision to adjust upward the monthly overall production by 0.4 mb/d starting on February 2022, was reconfirmed. The minor increase in supply by the group does not seem to impress traders but seems to motivate some buying interest for the time being. From this decision the OPEC group along with its distinguished partners like Russia seems to be sending some indirect messages that are truly worth mentioning. The current circumstances taking place around the world with the new variant dominating media headlines, is still keeping the OPEC plus group in a rather conservative stance, not willing to allow for excess supply to be inserted in the market. Evidently demand has improved compared to the same time in the past year as this is the reason prices have surged. In the beginning of January 2021 WTI prices were approximately trading at $50 per barrel which is significantly lower than the $77 per barrel valued today. Yet the fact that lockdowns are still a part of the global strategy to overcome the pandemic, the impact on the Oil market can be detrimental. Even currently, Oil demand could be on the back foot as the Omicron variant reels. Thus the OPEC plus group is forced to restrict output.
As we start the New Year Oil traders focus could be shifting to some long term view on the Oil markets that can possibly make it easier for them to form a trading strategy. 2022 may be a year that can possibly focus on other geopolitical matters in the Oil market that remain unresolved like the ongoing Iranian nuclear negotiations likely to be closely monitored by OPEC. In the short term we may continue to see Oil prices remaining at higher levels as demand may remain elevated possibly countering supply which is also expected to rise. Finally please note the higher energy prices observed in the last part of the previous year until the present moment have created many problems around the world. Inflation levels surging globally, energy crunch in China and the current turbulence in Kazakhstan are all related to higher energy prices.
Technical Analysis
WTI daily chart
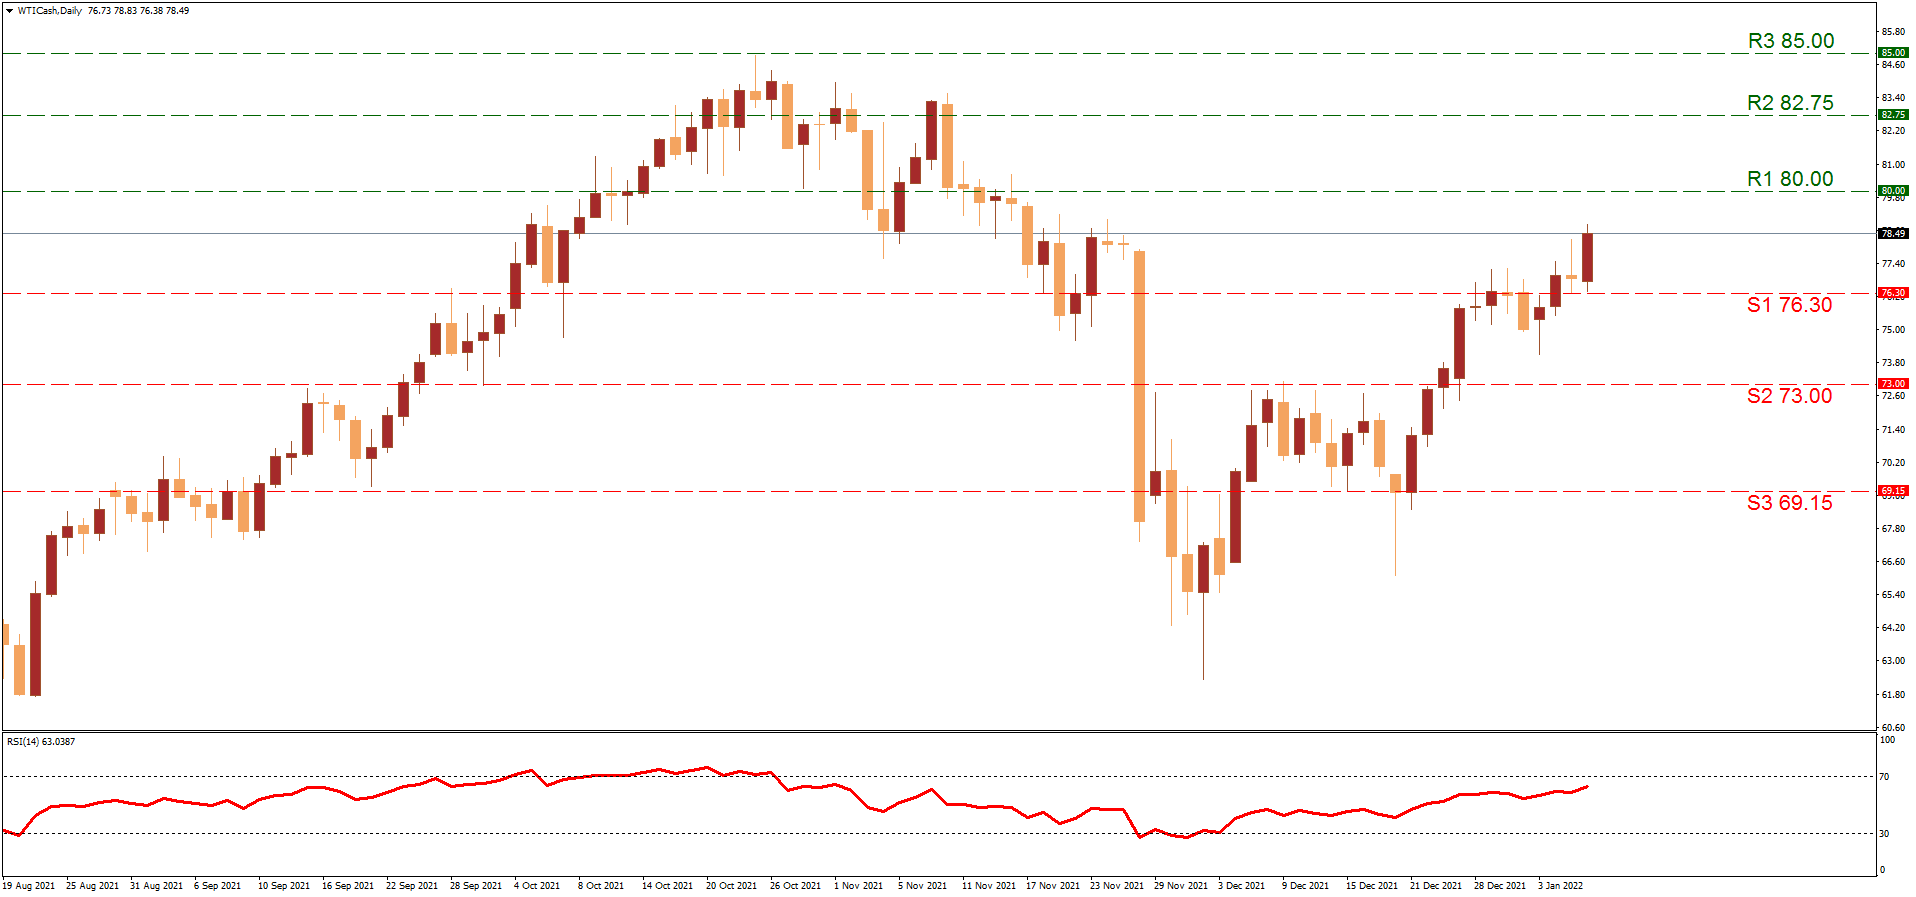
WTI continues to be in an ascending momentum that has commenced on the 2nd of December and remains intact. After stabilization at the (S1) 76.30 support level that was seen as a resistance, the price action has recently broken higher making the case for the (R1) 80.00 line to come into play. Above the (R1) we tend to note the (R2) 82.75 level that was reached for the last time in early November. Even higher the (R3) 85.00 line was briefly approached on the 25th of October and remains the most recent peak for WTI. If the commodity makes a turn downwards then the (S1) 76.30 level can be re tested. The (S2) 73.00 level remains the most possible stop if the selling is to persist further while the (S3) 69.15 level at the end can as be used as a support as it was on the 20th and 21st of December. The RSI indicator below our chart seems to be steadily climbing but has yet to reach the 70 level, This can signal some bearish tendencies in the short term. However, as the trend in our opinion remains upwards, the commodity continues to trade in a larger sideways motion between the (R3) and the (S3).


