
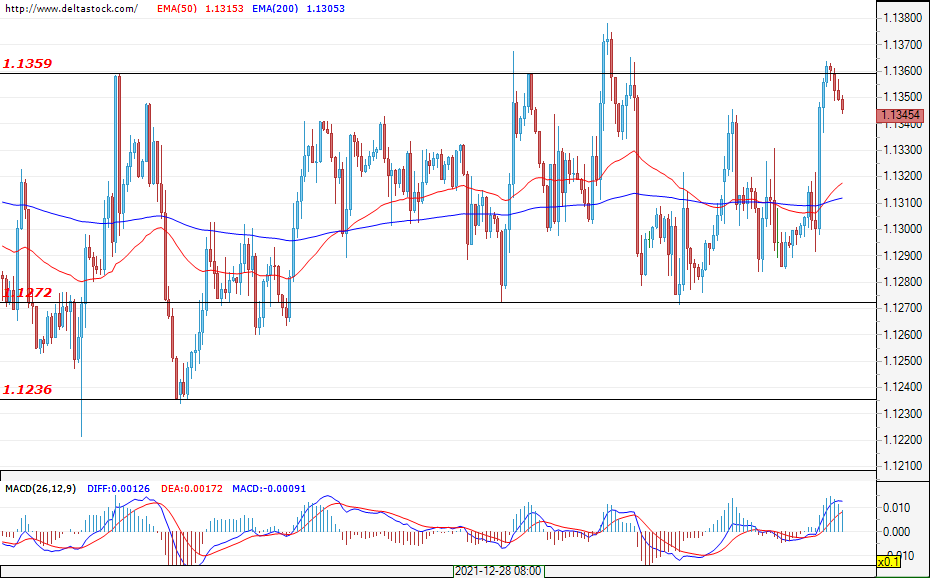
EUR/USD
Current level – 1.1345
The pair is still in the range-bound movement that began in late November and it seems that neither party is ready to take the initiative. On the higher time frames, the trend is in a decline and this may continue to be the case after the consolidation. Such a prolonged compression implies the accumulation of large trading volumes and a strong directional movement. The current expectations are in favour of the bears, but if the 1.1360 resistance is breached in the short term, it is possible that the EUR/USD could move towards 1.1510. This would attract more liquidity for the bears and create better market entry levels. Their goal will then be to breach the support within the 1.1180-1.1236 zone and continue further down towards 1.1000. The seasonal data supports the movement towards 1.1510, and the macro environment with rising U.S. interest rates suggests a strong dollar that supports bearish scenarios. A change in the trend can be expected if prices remain above 1.1600. In the early hours of today, the bulls are again experiencing difficulties at around 1.1360 and it is possible for the consolidation to continue. The first daily support the bulls can expect at around 1.1320, followed by the more solid one at 1.1272. The market is clearly expecting a catalyst, which might become the inflation data for the United States coming out on Wednesday at 13:30 GMT. Other events that may increase trading activity are the data on unemployment in the euro area (today; 10:00 GMT), as well as the Congress hearing of Jerome Powell on Tuesday at 15:00 GMT.
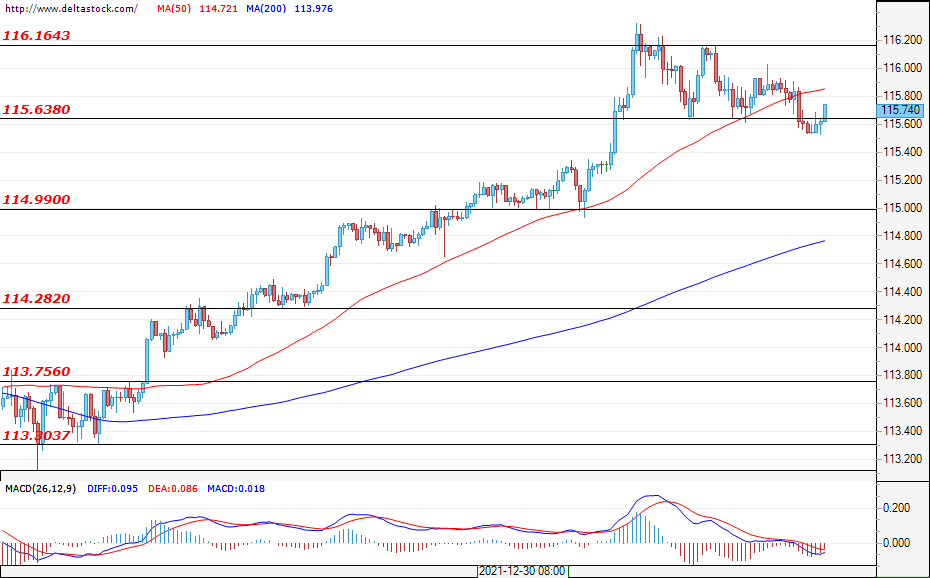
USD/JPY
Current level – 115.74
Last week, the uptrend entered a pullback and formed support at around 115.63. After the false breach of the zone, the upward momentum is expected to resume and the resistance at 116.16 is to be overtaken. In such a scenario, the target for the bulls would be the level at around 117.80. If the resistance at 116.16 is not violated, then it is likely for the market to enter a range phase. Possible bands for such a range could be the support at 114.30 and the resistance at 116.16.
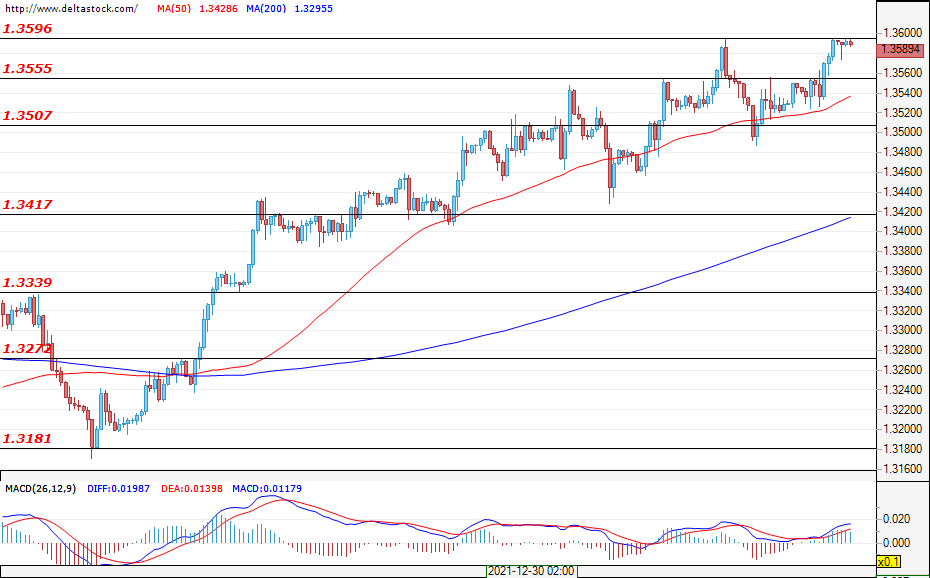
GBP/USD
Current level – 1.3589
The gains of the sterling do not seem sustainable and bullish impulses are currently being followed by deep retracements. Looking at the higher time frames, the mood still looks bearish, and the area at around 1.3600 looks attractive to sellers. The market is expected to enter a range phase, after which it could roll over into a downtrend. These expectations would change if the resistance at 1.3800 is breached. The first support for the bulls is the level of 1.3555, followed by that of 1.3507, and the main one lies at 1.3417. First resistances are 1.3600 and 1.3700.
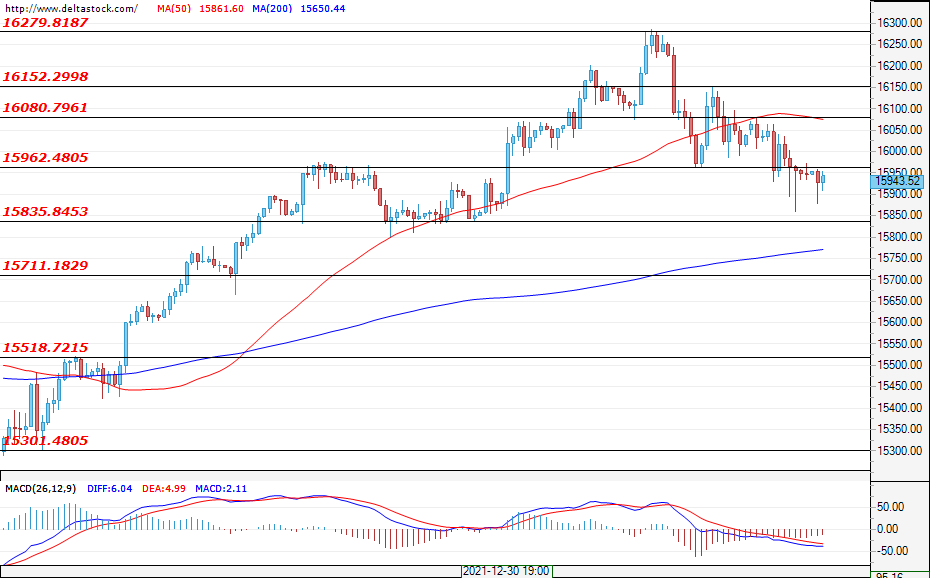
EUGERMANY40
Current level – 15943
The first week of the year was extremely volatile for the German index and, after nearly reaching the record highs of around 16297, it sold out massively. The declines were not unexpected and are currently limited to a technical retracement. The area around 15835 provided solid support and sell offers were rejected above this level. Expectations remain positive, at least until the integrity of the 15835 zone is compromised. The first resistances for the bulls are 15960, 16080 and 16150. The seasonal data supports the bullish scenario and it is possible for buyers to once again attack the high of 16280.
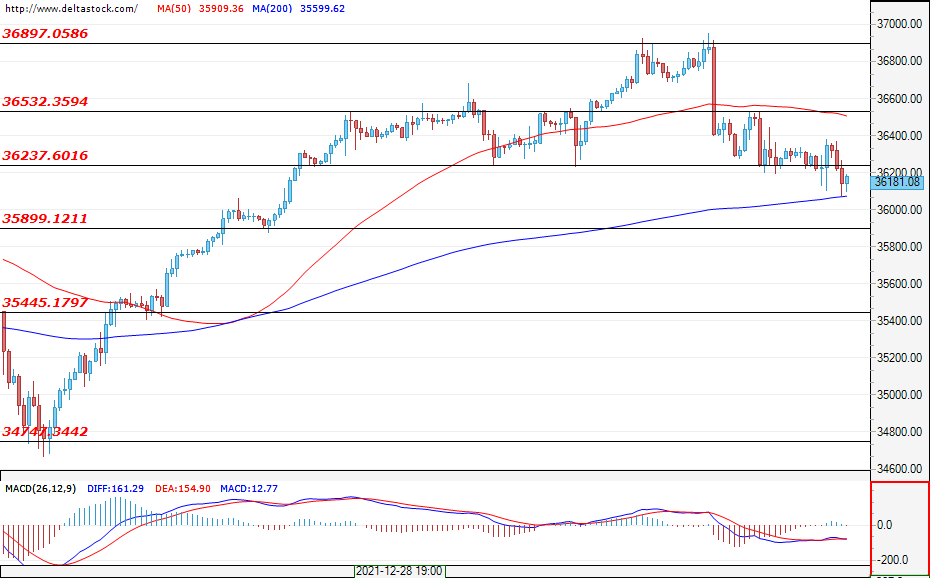
USD30
Current level – 36181
The Fed meeting minutes turned the week around for the U.S. markets and they were aggressively sold out after previously reaching new record highs. As a result, the breach of the key zone at 36237 is likely to be fake. If prices return above this level, then a renewal of the bullish momentum can be expected. The first resistance for the bulls is 36530, and the next one is the area around the record values at 36900. If the sell-off continues this week, the first support zones for the bulls would be 35900 and 35445.


