
Hello fellow traders. Another instrument that has given us nice trading opportunity recently is NZDJPY . In this technical article we’re going to take a look at the past charts of NZDJPY presented in members area of the of our website. The pair is showing incomplete bearish sequences in the cycle from the 10/21 peak. Consequently we expect to see further decline within October cycle. Recently we got a short term recovery that has given us opportunity to enter short trades again. Recovery has unfolded as Elliott Wave Double Three Pattern. In further text we’re going to explain the Elliott Wave pattern and trading strategy.
Before we take a look at the real market example, let’s explain Elliott Wave Double Three pattern.
Elliott Wave Double Three Pattern
Double three is the common pattern in the market , also known as 7 swing structure. It’s a reliable pattern which is giving us good trading entries with clearly defined invalidation levels.
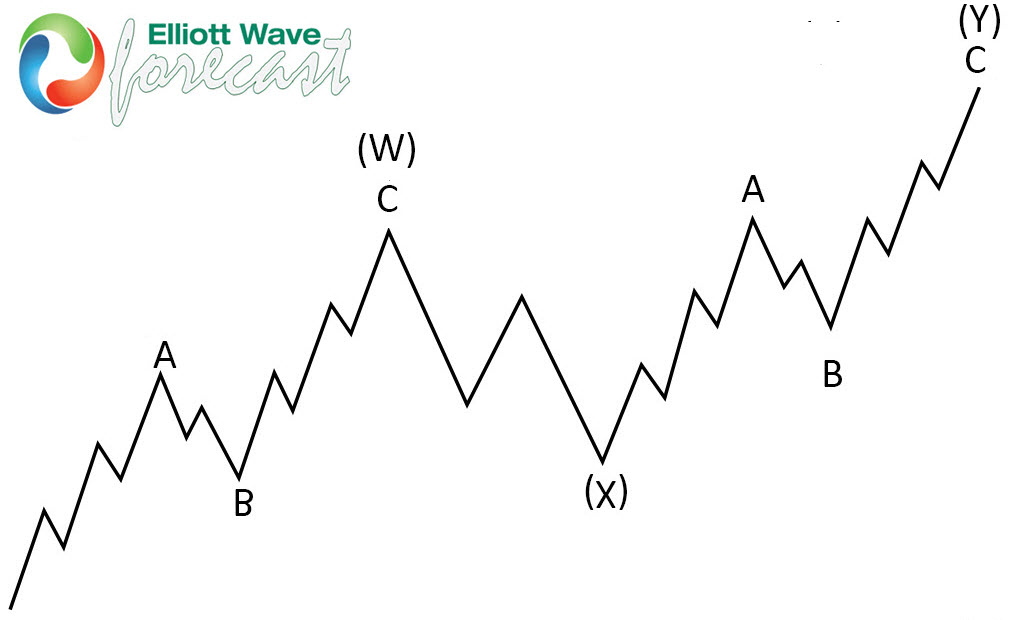
The picture below presents what Elliott Wave Double Three pattern looks like. It has (W),(X),(Y) labeling and 3,3,3 inner structure, which means all of these 3 legs are corrective sequences. Each (W) and (Y) are made of 3 swings , they’re having A,B,C structure in lower degree, or alternatively they can have W,X,Y labeling.
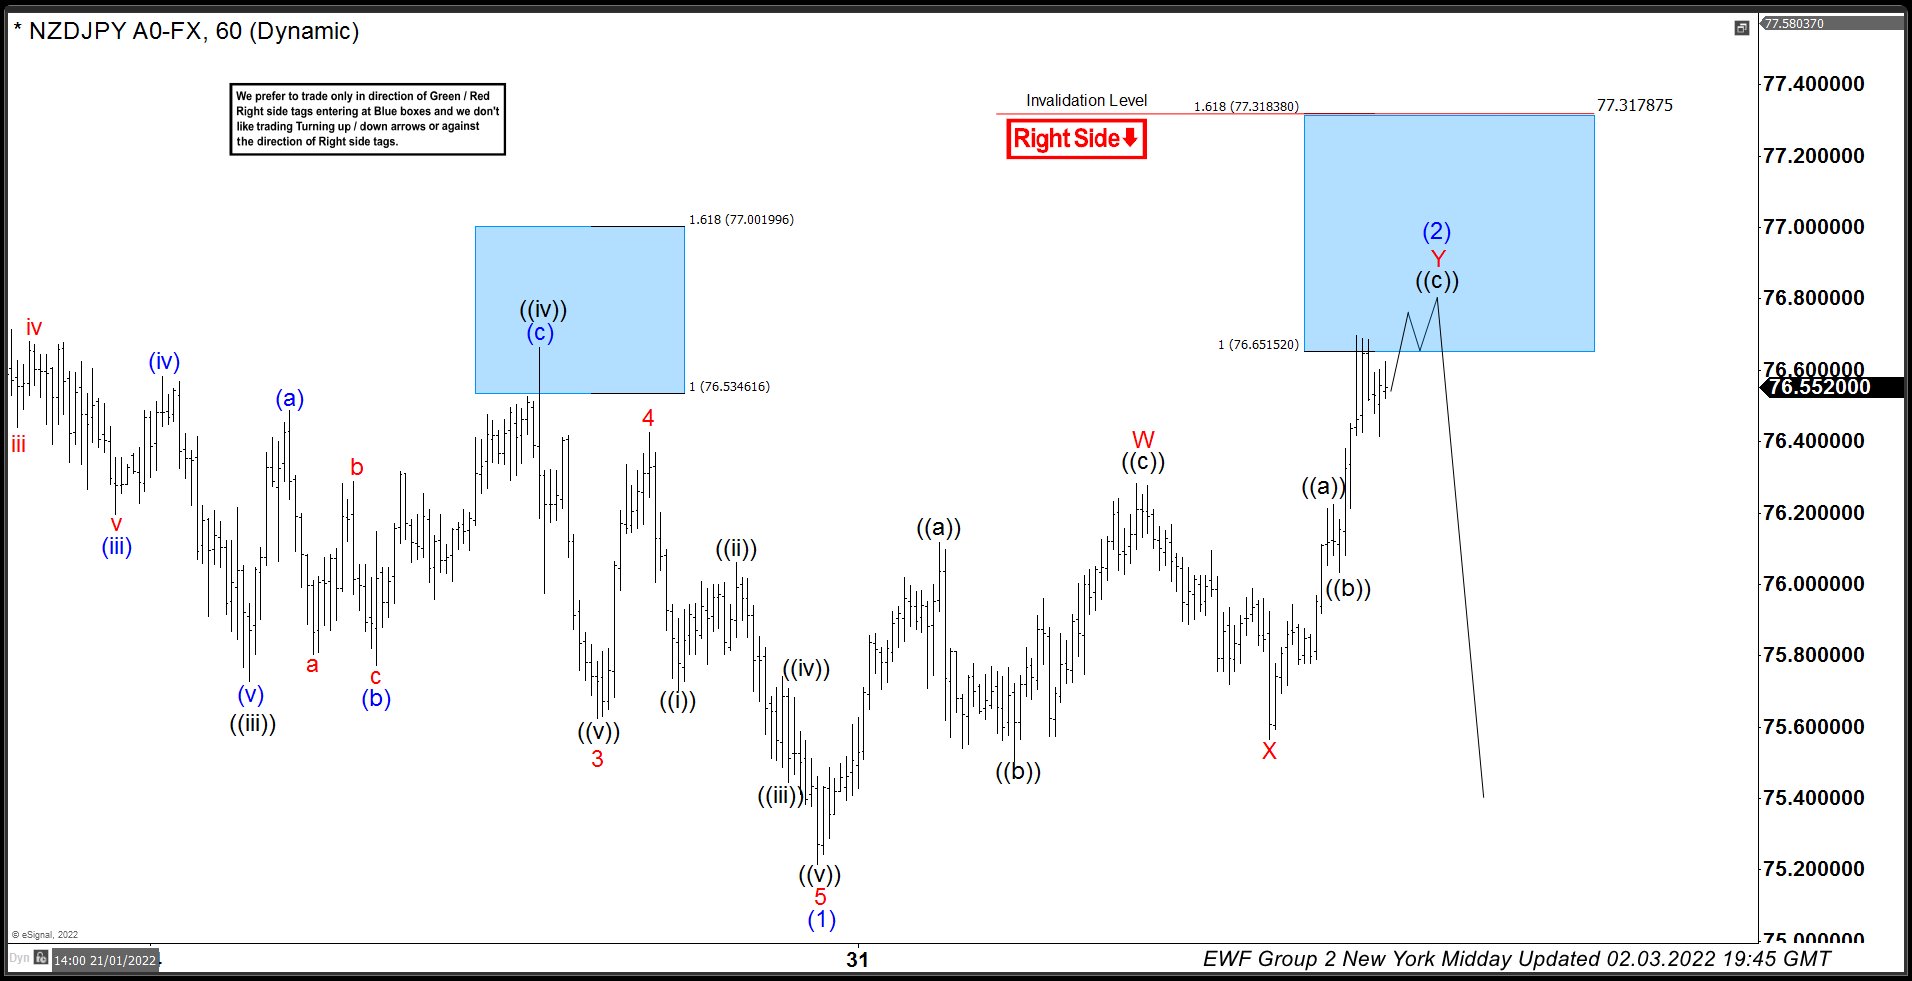
NZDJPY 1 Hour Elliott Wave Analysis 02.03.2021
NZDJPY is giving us (2) blue recovery that is unfolding as Elliott Wave Double Three Pattern. It’s having WXY inner labeling. We can see 3 waves up in W red leg. Then we got 3 waves bounce in X connector. Last leg up Y red is also counted as corrective structure – ((a)) ((b)) ((c)) Zig Zag pattern, when ((b)) was shallow pull back. Recovery has already reached the extremes at 76.65-77.31 , blue box area. At the marked blue box area, we expect sellers to appear and to pull price lower toward new lows ideally. As the main trend is bearish we expect to get at least 3 waves pull back from the selling zone. Once pull back reaches 50 Fibs against the X red connector, we will make short position risk free ( put SL at BE). Invalidation level for the trade is break above 1.618 fib extension (77.317).
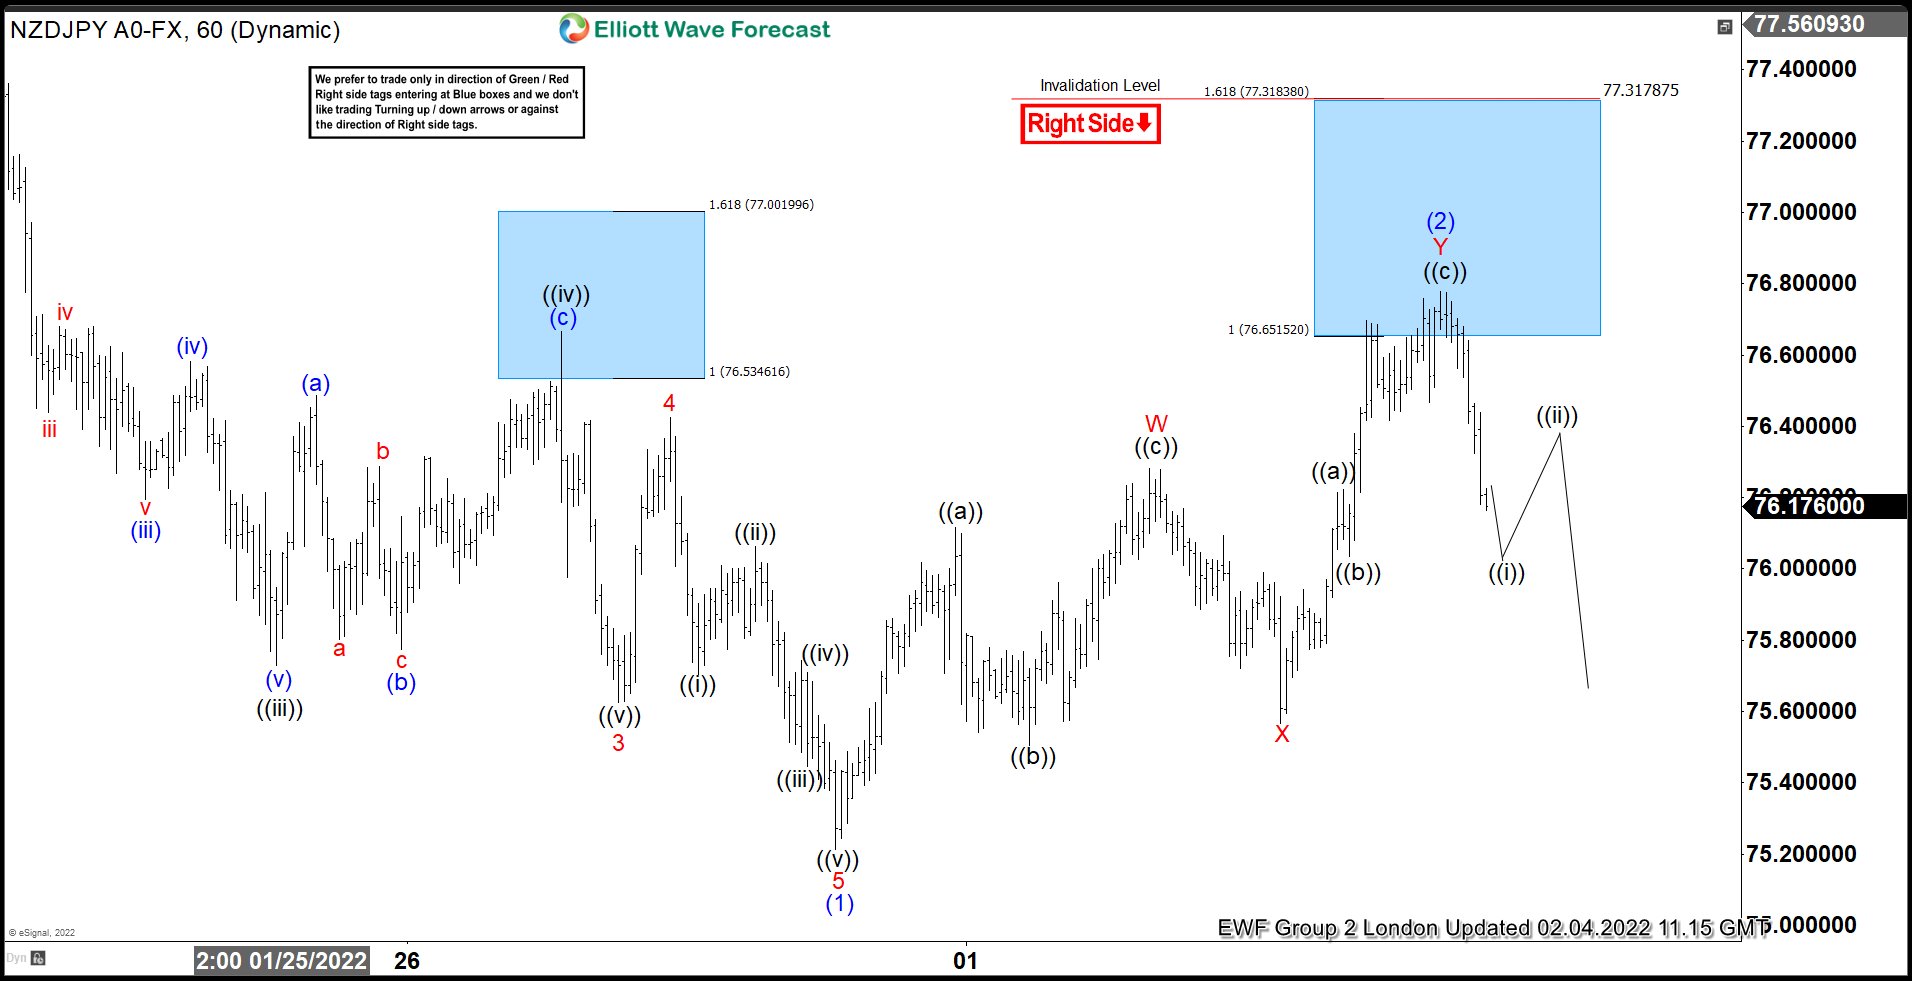
NZDJPY 1 Hour Elliott Wave Analysis 02.07.2021
Sellers appeared at the blue box area : 76.65-77.31 and we got good reaction from there. The decline from the blue box reached 50 fibs against the X connector, as a result members who took short positions should be enjoying profits in a Risk Free positions. At the moment we see wave (2) blue recovery completed at 76.78 high. Decline from that high high looks like unfolding as 5 waves – ((i)) and we expected to see bounce in ((ii)) before further decline ideally resumes .
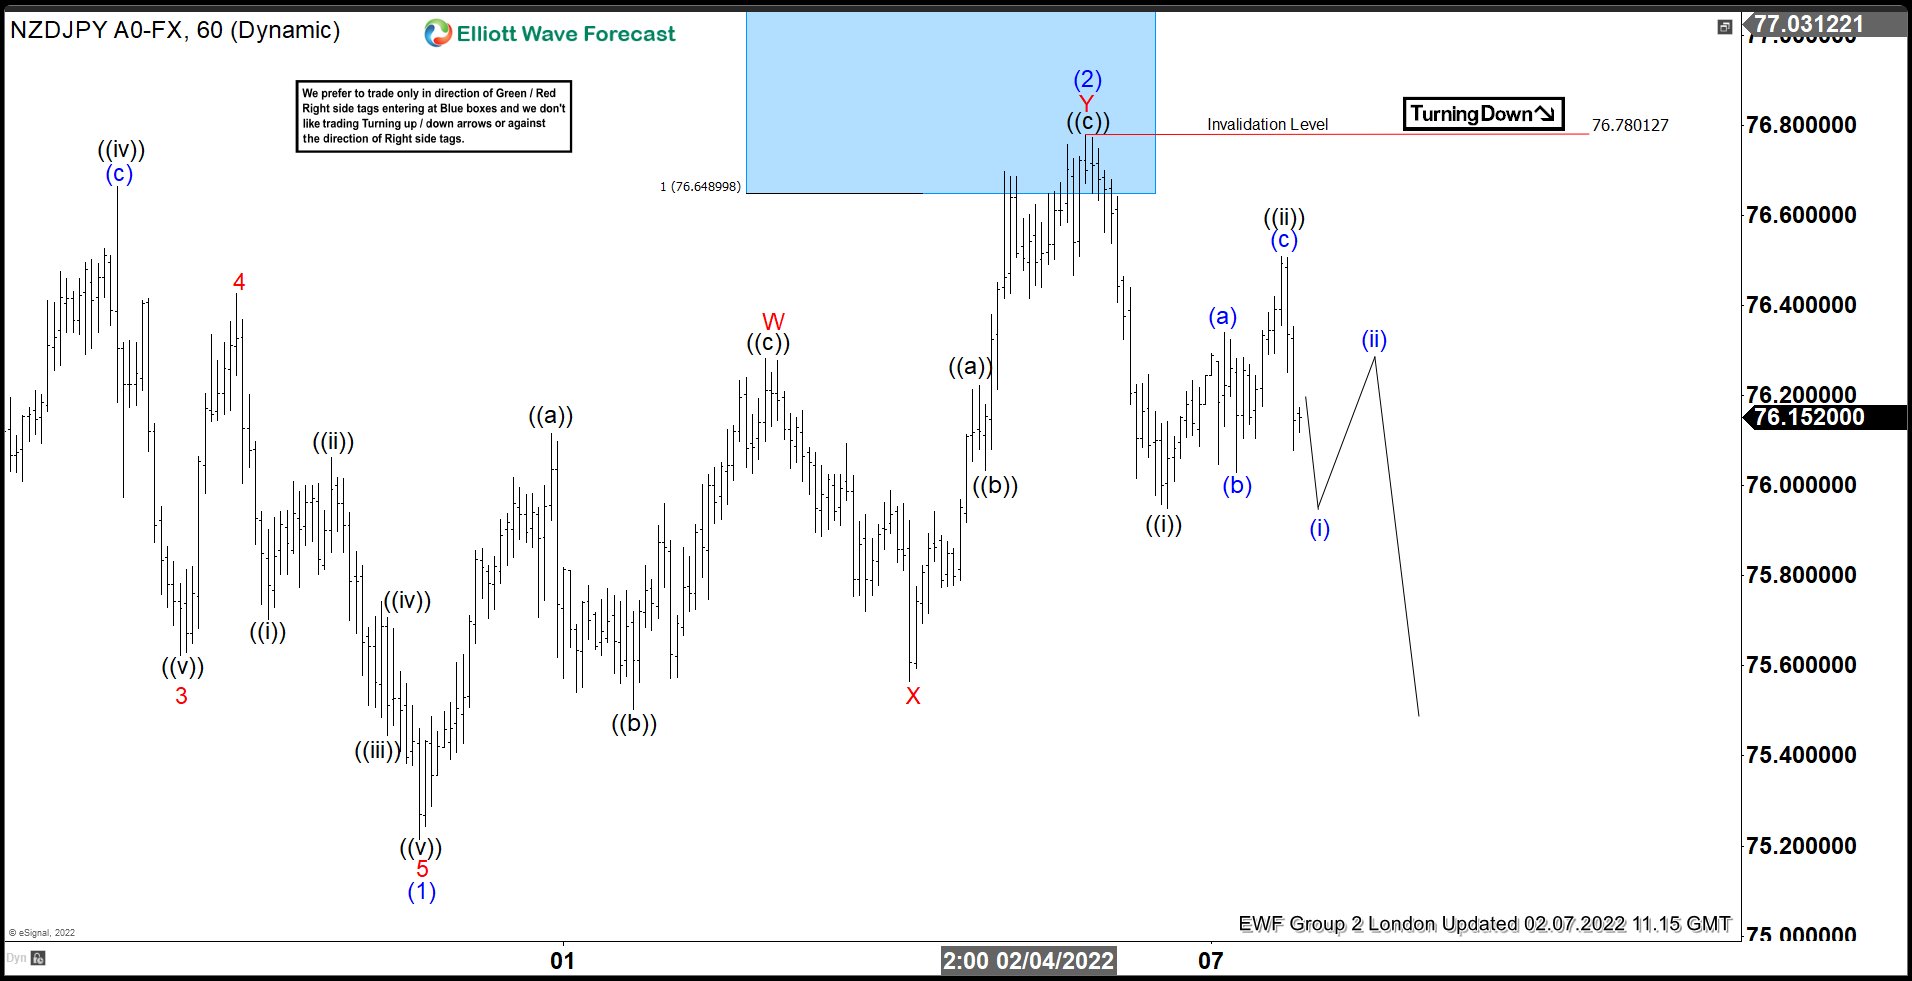
NZDJPY 1 Hour Elliott Wave Analysis 02.07.2021
We got short term bounce ((ii)) as expected. As far as the price stays below 76.49 , next short term tech zone to the downside comes at 75.67-75.47. Key level for this view is at 76.78 peak. If that level gives up , the pair will make another 3 waves up within correction (2) blue.
Keep in mind that market is dynamic and presented view could have changed in the mean time. Not every chart is trading recommendation. You can check most recent charts and new trading setups in the membership area of the site. Best instruments to trade are those having incomplete bullish or bearish swings sequences. We put them in Sequence Report and best among them are shown in the Live Trading Room.


