EUR/USD
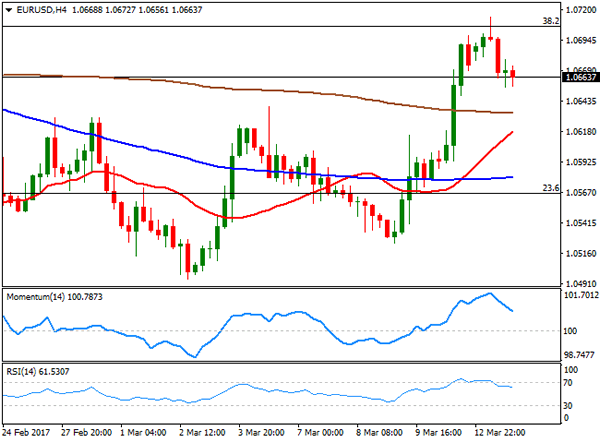
The EUR/USD pair closed the day in the green at 1.0665 after peaking at 1.0713, its highest since February 7th. Dollar’s broad weakness seen late Friday extended in a quiet macroeconomic journey, as there were no major releases in Europe or the US. The common currency continued to find demand on Friday’s headlines about ECB considering tapering ahead of the end of their QE program by the end of this year, maintaining a positive tone near term, although the absence of news, alongside with the upcoming Fed meeting next Wednesday, kept volumes at lows. Things will become more interesting on Tuesday, as Germany will release February inflation figures, and the March ZEW survey, the EU will unveil January Industrial Production, while in the US, February PPI will take center stage.
From a technical point of view, and despite the mentioned high, the pair has made little progress, given that no critical level has been broken. Around 1.0710, the pair has the 38.2% retracement of the post-US election slide, and investors have been unwilling to push the price beyond it ever since early February, amid political uncertainty at both shores of the Atlantic. Intraday and for the upcoming sessions, the 4 hours chart shows that technical indicators are easing from extreme overbought readings achieved at the beginning of the day, but also that the 20 SMA maintains a strong bullish slope after breaking above the 100 SMA, this last indicating a limited downward scope. A downward corrective movement towards the 1.0630 region seems likely, while a break below this last should favor a deeper downward corrective move.
Support levels: 1.0635 1.0600 1.0565
Resistance levels: 1.0710 1.0755 1.0790
USD/JPY
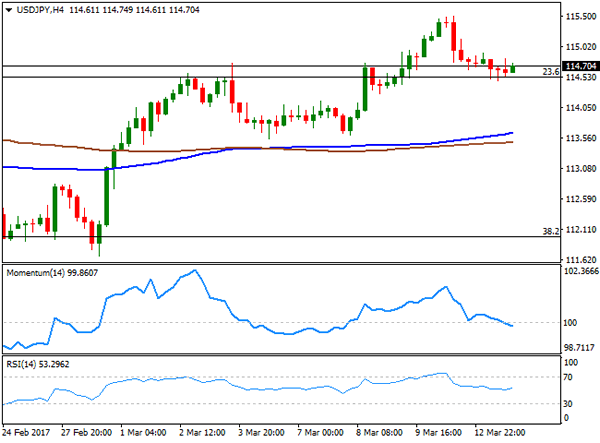
The USD/JPY pair ended the day flat around 114.70, confined to a tight 50 pips range ever since the day started, but with the scale leaned towards the downside. The Japanese yen saw some early demand, but mixed data coming from Japan kept the pair on check. The Producer Price Index came in at 1.0% YoY in February, matching expectations, but above previous 0.5%, while machinery orders plunged at the beginning of the year, down by 3.2% in January from a 6.7% advance in December, and falling 8.2% yearly basis. There was mounting speculation about the BOJ reducing their facilities, after headlines suggesting that, given the decline in yields, the Central Bank would need to buy less than the 80 trillion yen per year. Further keeping the pair limited were US Treasury yields that consolidated near their recent highs. The pair bounced modestly from a major Fibonacci support, the 23.6% retracement of the November/December rally around 114.50, but technical readings in the 4 hours chart fail to provide a clear sign on what’s next, as technical indicators hover around their mid-lines, whilst the large moving averages remain pretty much flat and converging within a tight range well below the current level.
Support levels: 114.50 114.15 113.70
Resistance levels: 115.10 115.50 115.85
GBP/USD
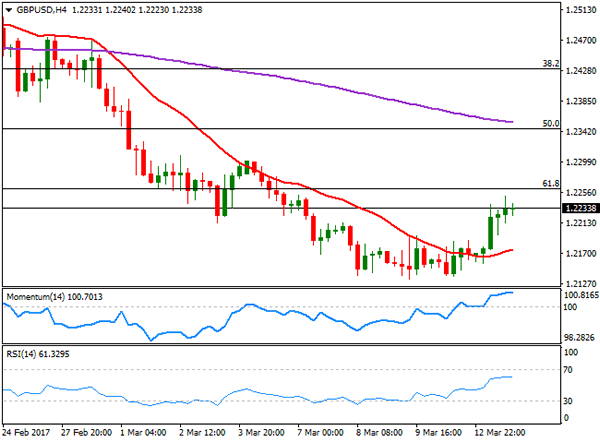
The Pound benefited from dollar’s weakness, with the GBP/USD pair regaining the 1.2200 level, and holding above it during the last two sessions. The pair traded as high as 1.2250, getting some help from Brexit´s Minister David Davis who asked the Parliament to clear the path for PM May to begin negotiations with the EU to begin the exit process. The Brexit bill returned to the House of Commons this Monday. Also, Scottish PM Nicola Sturgeon announced a plan to stage a second independence referendum within the next two years, claiming that UK PM May has ignored Scotland´s desires of maintaining full access to the EU single market after the Brexit. The news should have been Pound negative, but attention is now centered in the US and what the Federal Reserve will say this week. As it was the case for the EUR/USD pair, Pound’s recovery against the greenback stalled near a major Fibonacci resistance, the 61.8% retracement of the January rally around 1.2260. Technical readings in the 4 hours chart maintain the risk towards the upside, as the price settled well above a now bullish 20 SMA, whilst technical indicators have moderated their advances, but remain far above their mid-lines. A break above the mentioned resistance should open doors for an extension up to 1.2345, the 50% retracement of the same rally and February low.
Support levels: 1.2190 1.2150 1.2110
Resistance levels: 1.2260 1.2300 1.2345
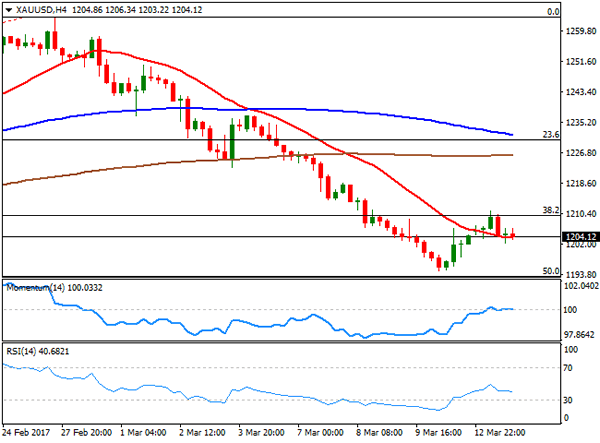
GOLD
Spot gold closed the day marginally lower at $1,204.10 a troy ounce this Monday, failing to sustain early gains, as the commodity traded as high as 1,211.13 due to broad dollar weakness. Different risk events, including Dutch elections, the US Federal Reserve meeting, and the possibility of UK’s May triggering the Art. 50 of the Lisbon Treaty, were not enough to fuel demand for the safe-haven asset, as bulls are side-lined on a possible rate hike in the US this Wednesday. From a technical point of view, the daily chart shows that the price retreated from around the 38.2% retracement of the December/February rally, whilst technical indicators keep heading south near oversold readings, maintaining the risk towards the downside. In the 4 hours chart, the price settled around its 20 SMA, whilst technical indicators remain horizontal, the Momentum around its 100 level and the RSI indicator around 40. The 50% retracement of the mentioned rally stands at 1,193.00, still the main support and the level to break to confirm additional slides during the upcoming sessions.
Support levels: 1,197.10 1,188.20 1,180.50
Resistance levels: 1,210.00 1,218.50 1,226.70
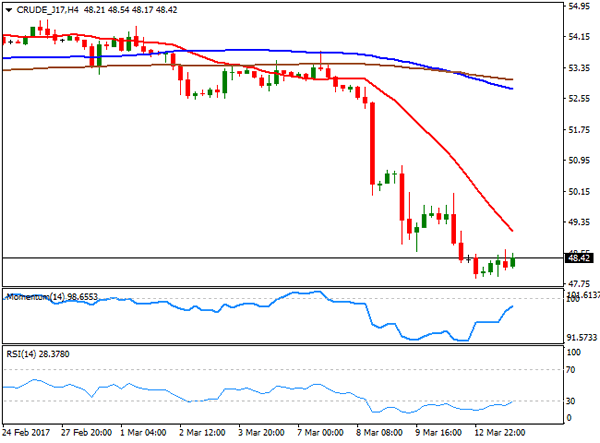
WTI CRUDE
Crude oil prices extended their declines at the beginning of the week, with WTI futures trading as low as $47.90 a barrel before settling at 48.40, unchanged from Friday’s close. There were no major news coming from the sector, with the market now eyeing EIA’s weekly storage report to decide whether to extend the sell-off or re-buy the commodity. The technical outlook is still bearish, given that in the daily chart, the price has remained well below all of its moving averages, whilst technical indicators pulled modestly higher within oversold territory, rather reflecting the latest bounce than confirming downward exhaustion. In the shorter term, and according to the 4 hours chart, the technical picture is quite alike, with the RSI recovering modestly, but standing now at 26, the Momentum indicator heading higher below the 100 level, and the 20 SMA maintaining a sharp bearish slope, now around 49.10, and providing a dynamic resistance in the case of an upward move.
Support levels: 48.00 47.30 46.65
Resistance levels: 49.10 49.75 50.40
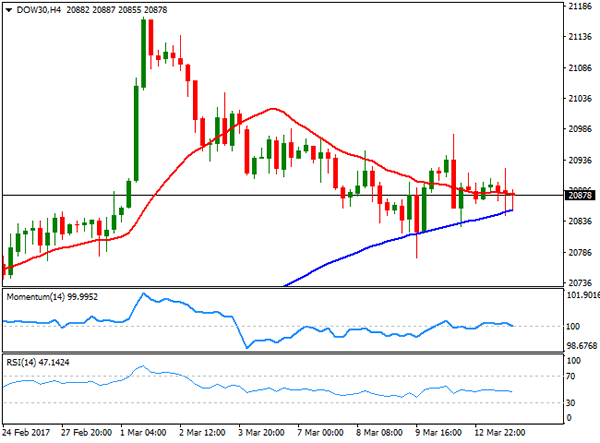
DJIA
US stocks saw little action this Monday, with the three major indexes closing mixed, but not far from their opening levels. The Dow Jones Industrial Average closed in the red, down 21 points or 0.10%, to 20,881.48. The Nasdaq Composite added 14 points, to 5,875.78, while the S&P closed 0.04% higher at 2,373.47. Cautious prevailed ahead of the Federal Reserve meeting this Wednesday, exacerbated by the absence of macroeconomic headlines to drive the mood. Within the Dow, Walt Disney topped winners’ list, adding 0.52%, whilst El du Pont added the same percentage. Intel was the worst performer, down 2.23%, followed by General Electric that lost 1.39%. From a technical point of view, the DJIA held a few points above its 20 DMA, currently at 20,852, whilst technical indicators have lost directional strength, but hold within positive territory, with the RSI indicator holding around 64, all of which limits the possibility of a steeper decline. In the 4 hours chart, the index remains stuck around a modestly bearish 20 SMA, and above a still bullish 20 SMA, although the fact that both moving averages are so close, with the shortest easing, is a first sign of bearish pressure. In this last chart, however, the Momentum indicator bounced modestly from the 100 level, whilst the RSI indicator remains flat in neutral territory, failing to provide clear directional signs for the upcoming sessions.
Support levels: 20,852 20,817 20,777
Resistance levels: 20,922 20,978 21,045
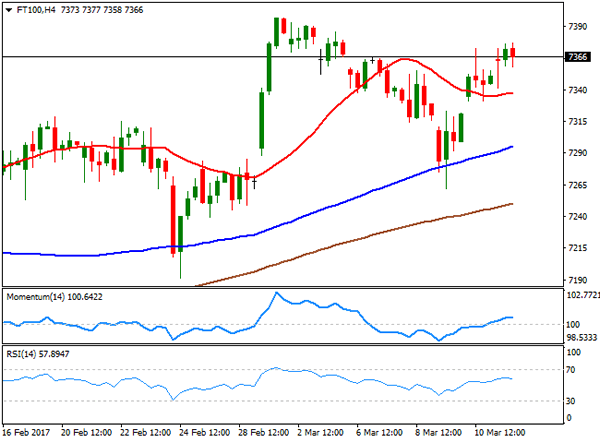
FTSE 100
The FTSE 100 managed to advance for a second consecutive day, adding 24 points to close at 7,367.08, underpinned by a recovery in the mining-related sector. Equities traders shrugged off Brexit concerns and a stronger Pound, focusing on the advance in base metals. Fresnillo led advancers, adding 5.59%, followed by Antofagasta which added 4.88%. Anglo American gained 4.03%, while Rio Tinto advanced 3.96%. Financials underperformed all across the region, and within the Footsie, Standard Life shed 2.24%, Royal Bank of Scotland lost 151%, while Barclays closed 0.71% lower. Technically, the daily chart shows that the London benchmark retains a modestly positive tone, holding above its 20 DMA and with technical indicators bouncing from their mid-lines, although with limited upward momentum. In the shorter term, and according to the 4 hours chart, the upward potential is a bit more constructive, as the index extended its advance above a now flat 20 SMA, whilst technical indicators maintain their bullish slopes within positive territory and at fresh 2-week highs.
Support levels: 7,332 7,306 7,262
Resistance levels: 7,397 7,420 7,450
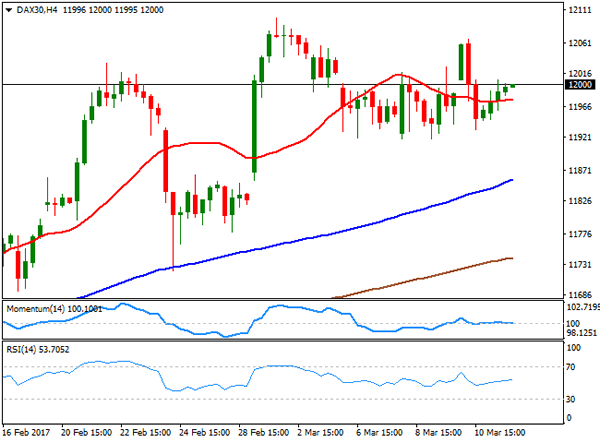
DAX
European equities closed little changed this Monday, with the German DAX up 26 points or 0.22%, to close at 11,990.03, with automakers leading the way higher. There were no major news coming from Germany, but the country will release the final revisions for February inflation, expected to remain unchanged, and the ZEW confidence survey for March, expected to improve from February’s setback. ThyssenKrupp was the best performer, advancing 2.30%, followed by Volkswagen that gained 1.53% and Daimler which added 1.50%. The worst performer was Deutsche Boerse that shed 0.63%, while Commerzbank closed 0.05% lower and Deutsche Bank also posted a modest lost. The index flirts with 12,000 ahead of the Asian opening, still holding above a bullish 20 SMA, today at 11,920, while the RSI indicator heads north around 60, whilst the Momentum indicator holds around its 100 level. In the 4 hours chart, the index maintains a neutral stance, as the index is a few pips above a flat 20 SMA whilst technical indicators head nowhere around their mid-lines.
Support levels: 11,909 11,857 11,819
Resistance levels: 12,018 12,067 12,100