
- Natural gas reversed from support zone
- Likely to rise to resistance level 7.50
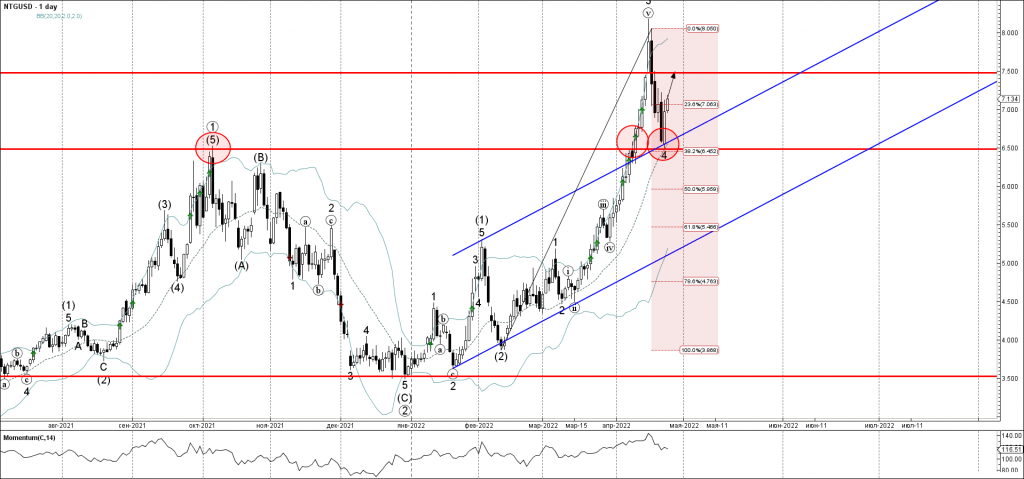
Natural gas recently reversed up from the powerful support zone located between the pivotal support 6.50 (former multi-month high from October of 2021), 20-day moving average, upper trendline of the daily up channel from January and the 38.2% Fibonacci correction of the upward impulse from February
The upward reversal from this support zone stopped the earlier minor corrective wave 2.
Given the clear daily uptrend – Natural gas can be expected to rise further toward the next resistance level 7.50.


